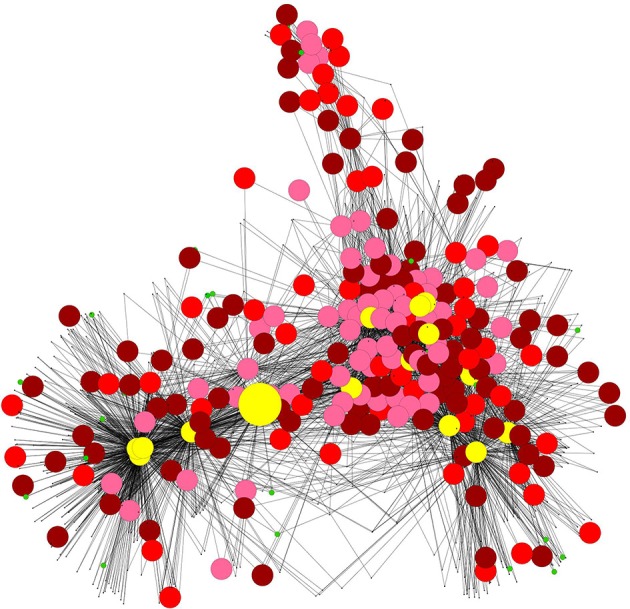
Figure 1.

SSR network. Co-expression network analysis performed with CressExpress using public transcriptome datasets. Cytoscape was used for the graphical representation of the network. Pink circles, red circles and purple circles indicate respectively genes induced at dawn in three, two or only one of the starch-deficient mutant lines. Green circles indicate genes repressed at the end of the night. Black dots indicate genes with stable expression in the three mutant lines under the conditions of the present study. The yellow circles correspond to the 15 genes highly connected (more than 100 neighbors). These candidate regulatory genes belong to several metabolic pathways: lipid catabolism (At3g51840, At5g04040), cell redox homeostasis regulation (At2g37130, At5g10860), amino acid metabolism (At2g39570, At2g40420, At3g45300), protein transport (At1g80920), trehalose biosynthesis (At1g23870), three uncharacterized proteins (At4g28300, At4g28040, At2g32150), a protein kinase (STY46), a transcription factor (UPBEAT1) and a blue light receptor (PLPB). The central bigger yellow circle correspond to the protein kinase STY46.
