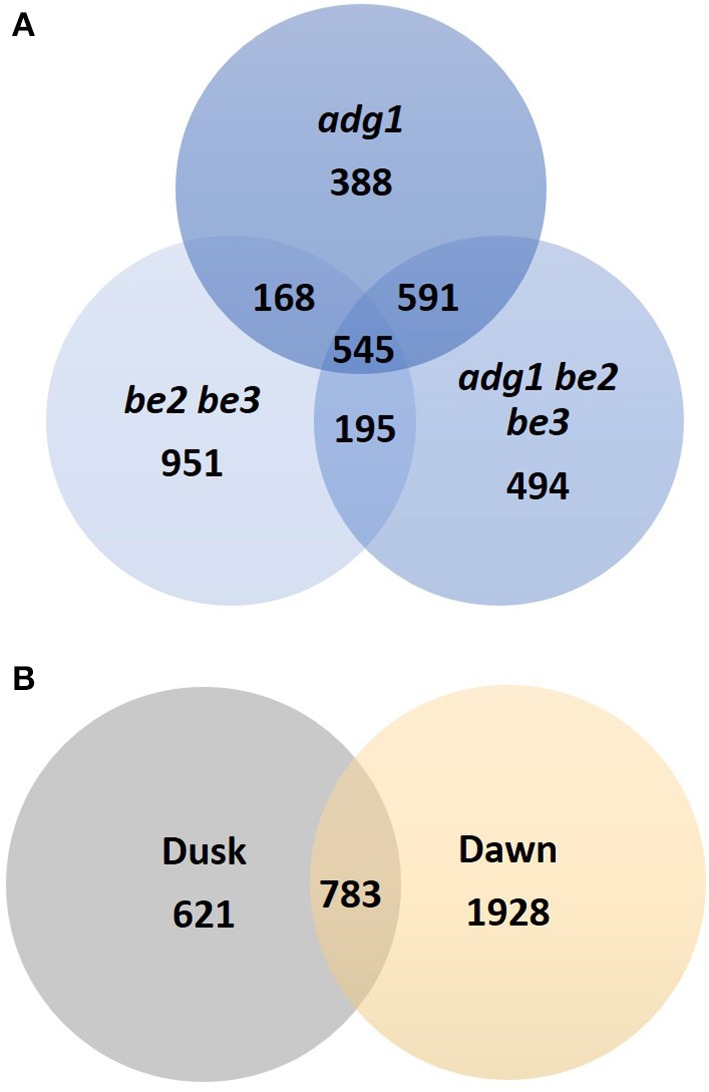
Figure 2.

Venn diagrams of genes identified as differentially expressed. (A) Genes identified as differentially expressed in adg1, adg1 be2 be3, and be2 be3 mutants. (B) Venn diagram showing the circadian regulation of differentially expressed genes in the three mutant lines.
