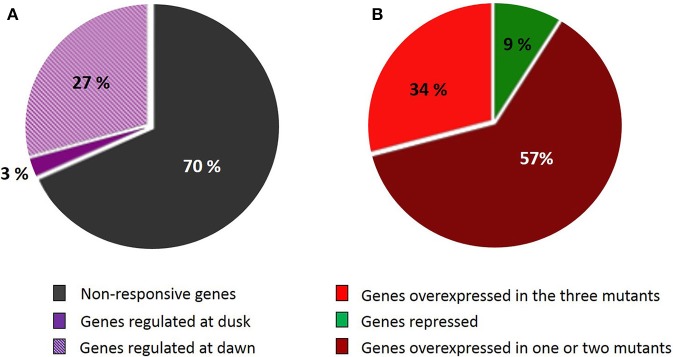
Figure 3.

Genes belonging to the SSR network showing different pattern of expression in the starch-deficient mutant lines. (A) The ripped zone represents the percentage of genes repressed or overexpressed at dawn in at least one of the mutants; the violet zone represents genes up- or down-regulated at dusk in at least one of the mutants and the gray zone represents genes showing a stable level of expression at the two times of sampling. (B) Percentage of genes that repressed or overexpressed in adg1, adg1 be2 be3, and be2 be3 microarray experiments at dawn (ripped zone of A). Red color represents genes overexpressed in the three mutants; dark red represents genes overexpressed in one or two mutant lines and green represents genes repressed in the starch-deficient mutant lines.
