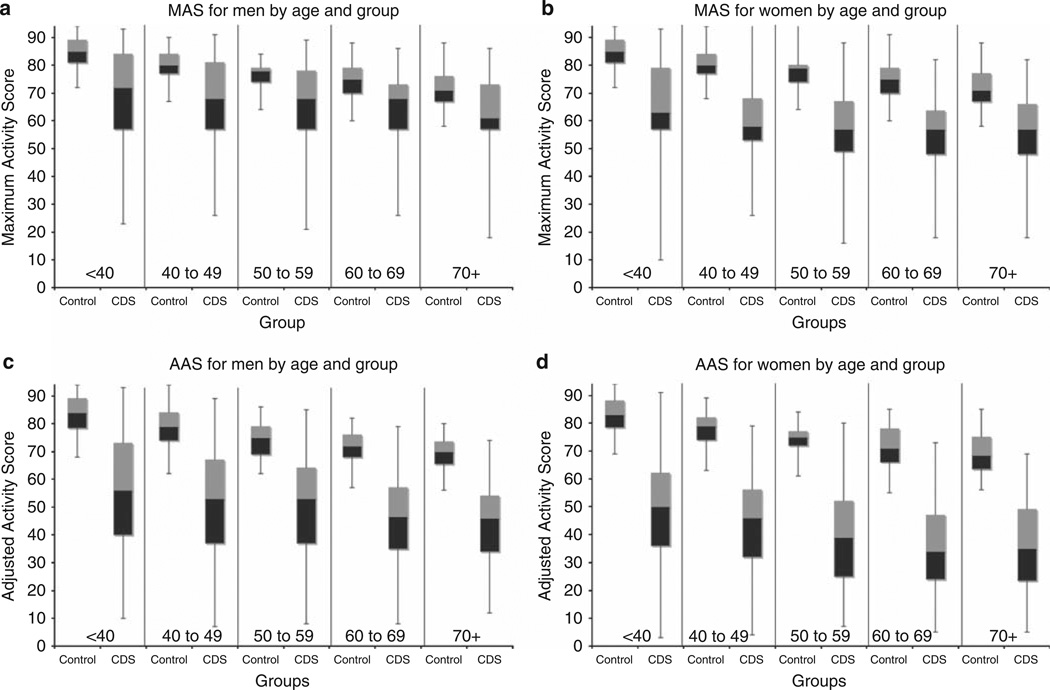
Figure 1. Human Activity Profile (HAP) scores among men and women in the Comprehensive Dialysis Study (CDS) compared with norms for healthy individuals.
The black boxes represent the 25th to 50th percentile; gray boxes represent the 50th to 75th percentile; lines above and below extend to the 99th and 1st percentile, respectively. In each figure, scores are shown by age group, beginning with age <40 and progressing by decade to age 70+ years. Within each age group, normative data are represented on the left and CDS participants’ data are plotted on the right. (a, b) Maximum Activity Scores (MAS) and (c, d) Adjusted Activity Scores (AAS) for men and women are shown.

