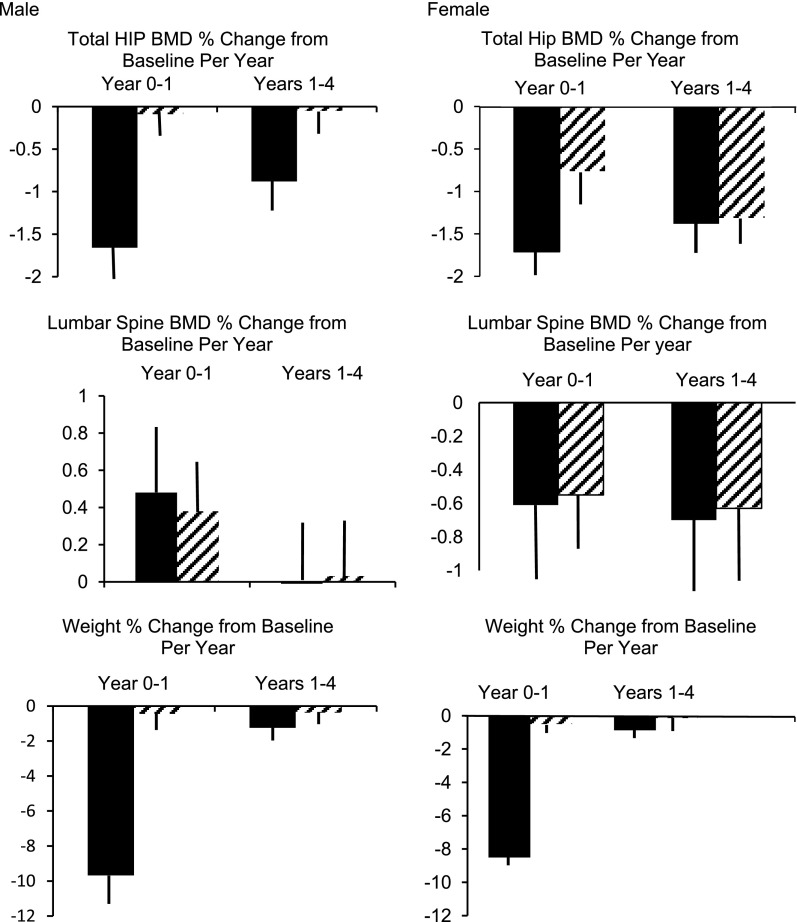
Figure 1.
Mean percent change in BMD per year (± SEM) for the intervals of 0–1 year and 1–4 years of follow-up derived from repeated-measures (mixed) modeling of the relationship between time and change in BMD. The solid bars represent the ILI group, and the striped bars represent the DSE group. Adjusted for age, ethnicity, study center, insulin use, TZD use, menstrual status (for female models only), duration of diagnosed diabetes, BMI, proteinuria, and smoking status (all baseline values).

