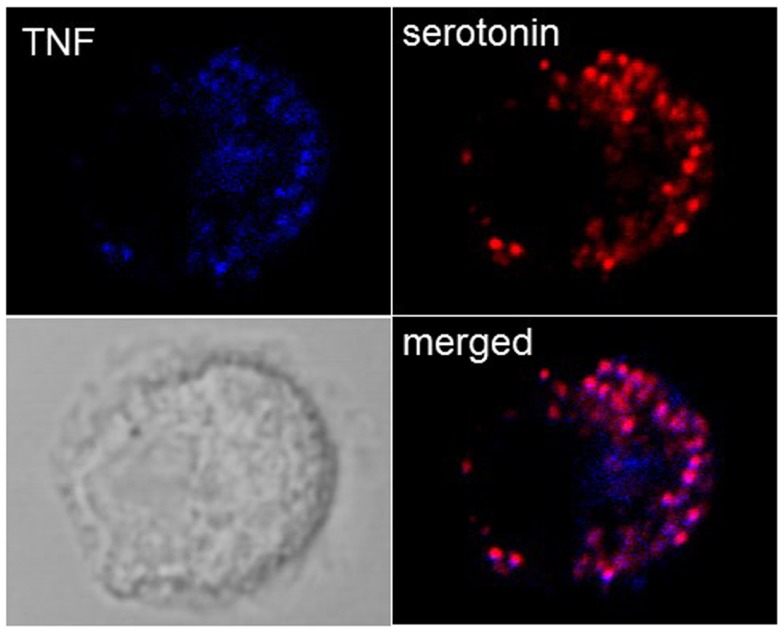
Figure 2.
Localization of TNF in SG in cultured BMMC. Colocalization of TNF (blue) with the SG markers serotonin (red) were analyzed in non-stimulated BMMC using confocal microscopy. Representative single optical sections and overlay (Merge) and the DIC images are shown. Note that in a single field only few cells show such TNF SG granular staining.

