
Figure 1.
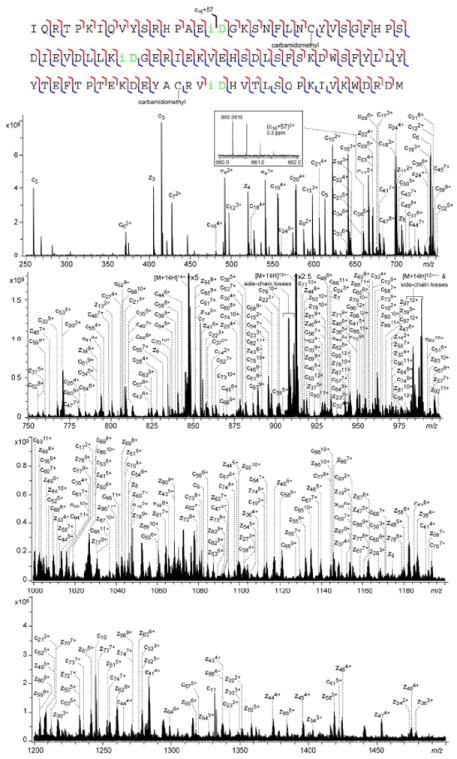
Top-down ECD spectrum of the reduced/alkylated and aged β2M in 14+ charge state, shown in four segments for clarity. The cleavage map is shown on top of the spectrum. The inset shows the N-terminal diagnostic ion for isoAsp17.
Official websites use .gov
A
.gov website belongs to an official
government organization in the United States.
Secure .gov websites use HTTPS
A lock (
) or https:// means you've safely
connected to the .gov website. Share sensitive
information only on official, secure websites.
Top-down ECD spectrum of the reduced/alkylated and aged β2M in 14+ charge state, shown in four segments for clarity. The cleavage map is shown on top of the spectrum. The inset shows the N-terminal diagnostic ion for isoAsp17.