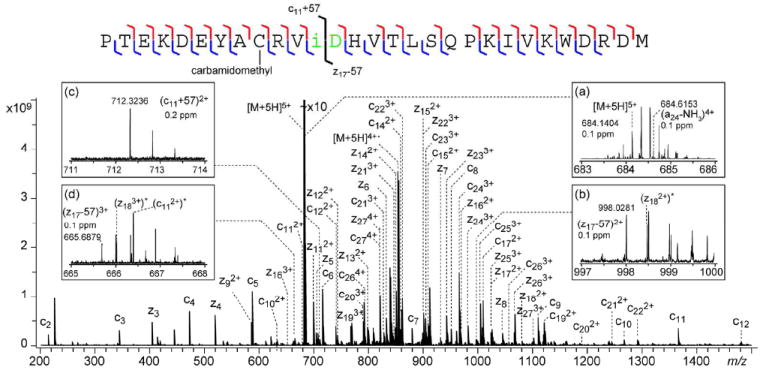
Figure 3.

NSD-ECD spectrum of the y285+ ion generated from the aged β2M, with the cleavage map shown on top of the spectrum. Inset (a) shows the enlarged region at the precursor ion m/z, insets (b-d) show the N- and C-terminal diagnostic ions for isoAsp83. * denotes peaks resulting from ECD of the co-isolated (a24-NH3)4+ ion.
