
Figure 4.
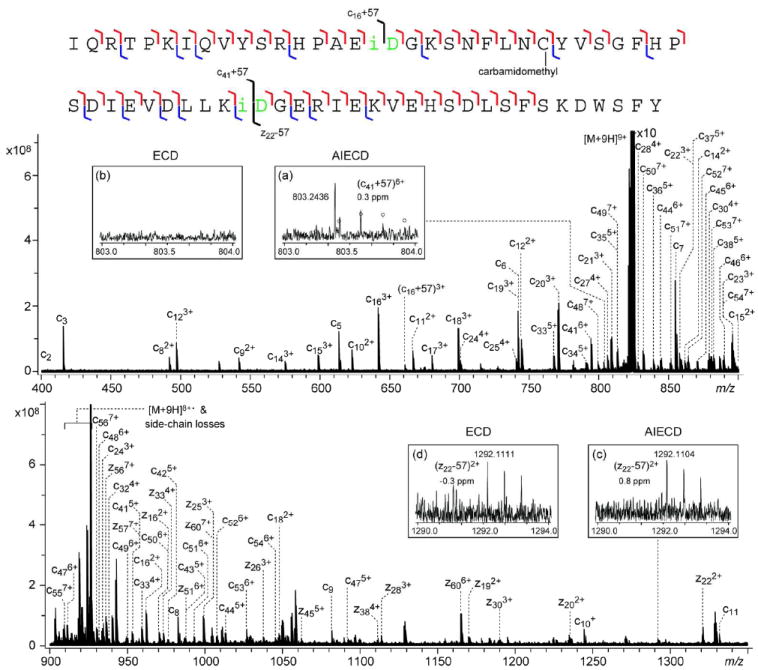
NSD-AI-ECD spectrum of the b639+ ion generated from the aged β2M, shown in two segments for clarity. The cleavage map is shown on top of the spectrum. Insets (a) and (b) show the comparison between the NSD-AI-ECD and NSD-ECD spectra at the N-terminal isoAsp42 diagnostic ion region; insets (c) and (d) show the comparison at the C-terminal isoAsp42 diagnostic ion region.