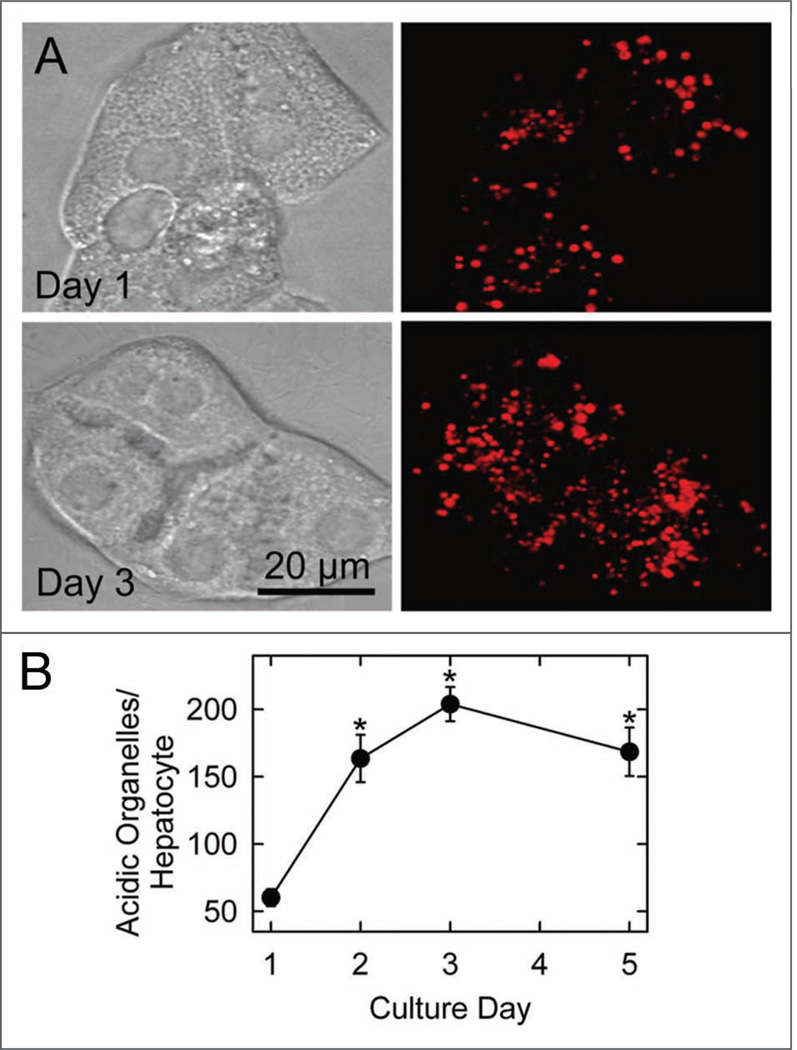
Figure 4.
Increase of acidic organelles during hepatocyte remodeling. Cultured hepatocytes were loaded with LTR to label acidic organelles and imaged, as described in Material and Methods. Bright field (left) and superimposed confocal fluorescence image stacks (right) are shown in (A) for representative Day 1 and Day 3 hepatocytes. In (B), the average number of acidic organelles per hepatocyte is plotted versus culture day. Values are means ± S.E.M (n = 10 per group). *p < 0.001 compared to Day 1.

