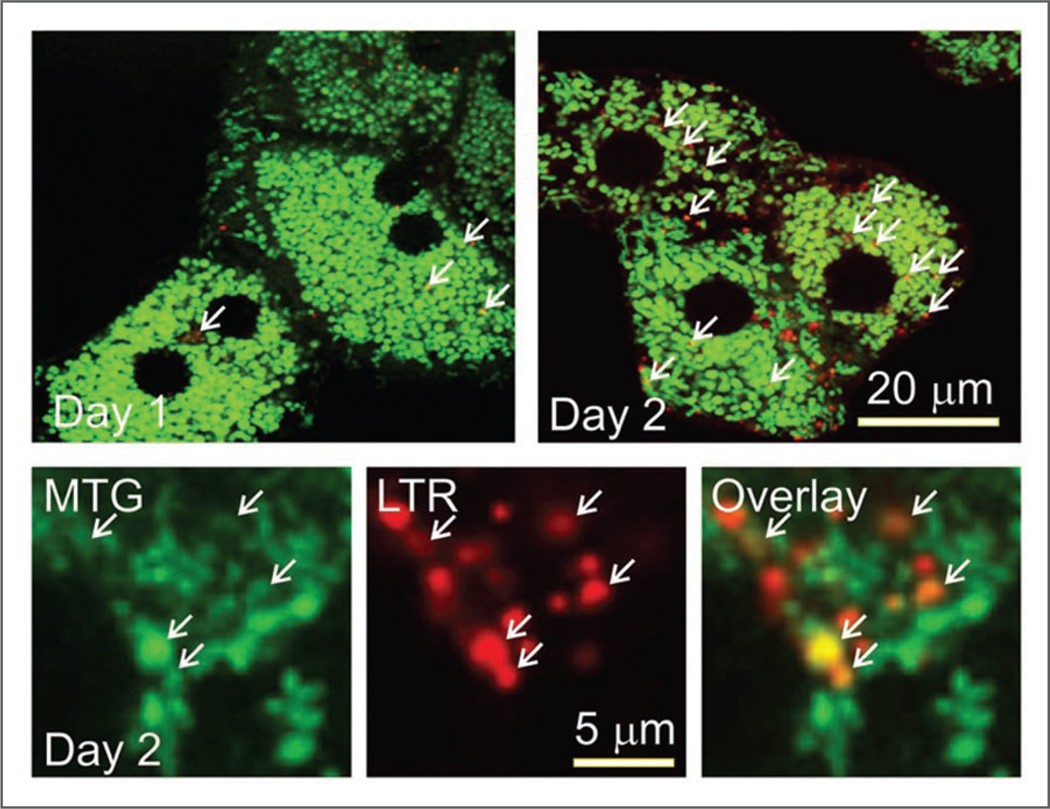
Figure 5.
Mitochondrial translocation into acidic organelles during hepatocyte remodeling. Hepatocytes cultured for 1 and 2 days were co-loaded with MTG and LTR and imaged, as described in Material and Methods. Arrows identify superimposition of green fluorescing mitochondria with redfluorescing autolysosomes (orange-yellow in color overlay). Lower panels show individual green, red and overlay images at higher power of a portion of the cytoplasm of a Day 2 hepatocyte. Experiments are representative of 5 for each condition.

