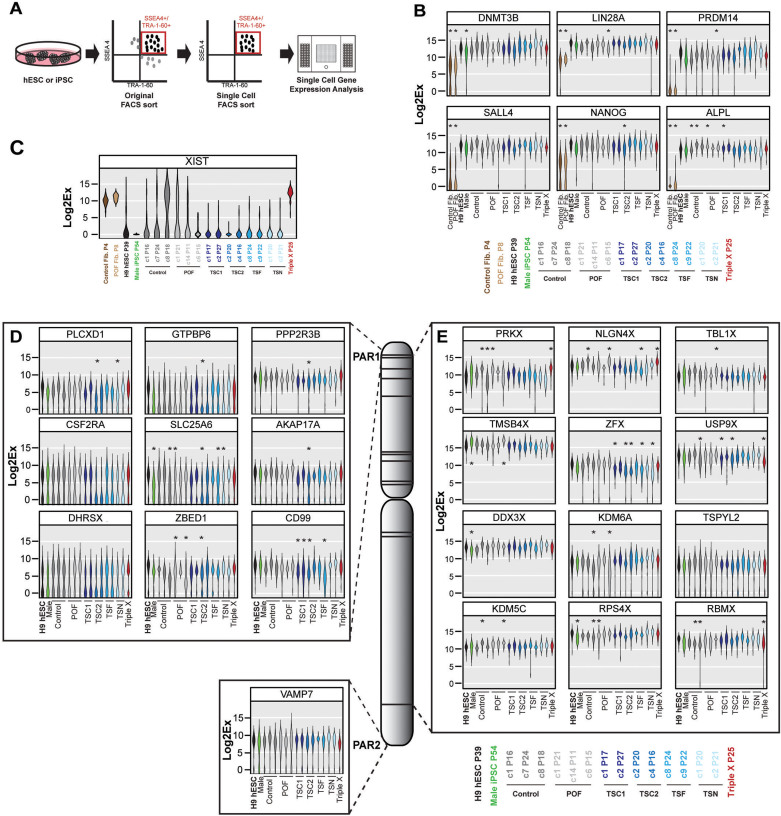
Figure 2. Single cell analysis of pluripotency genes and pseudoautosomal regions and genes that escape XCI in pluripotent stem cells.
(A) Schematic of sorting method used to identify and isolate single pluripotent cells for gene expression analysis. (B–E) Violin plot representation of Log2Ex values (fold change above background) of single cells for (B) pluripotency genes in fibroblasts, hESC or iPSC subclones (C = subclone), (C) XIST, (D) genes on PAR1 and PAR2 and (E) genes that escape XCI genes on the X chromosome in hESC and iPSC subclones. Asterisk indicates a significant difference in expression (p-value < 0.01) when compared to H9 hESCs. Color-coded subclone information is provided.

