Figure 3.

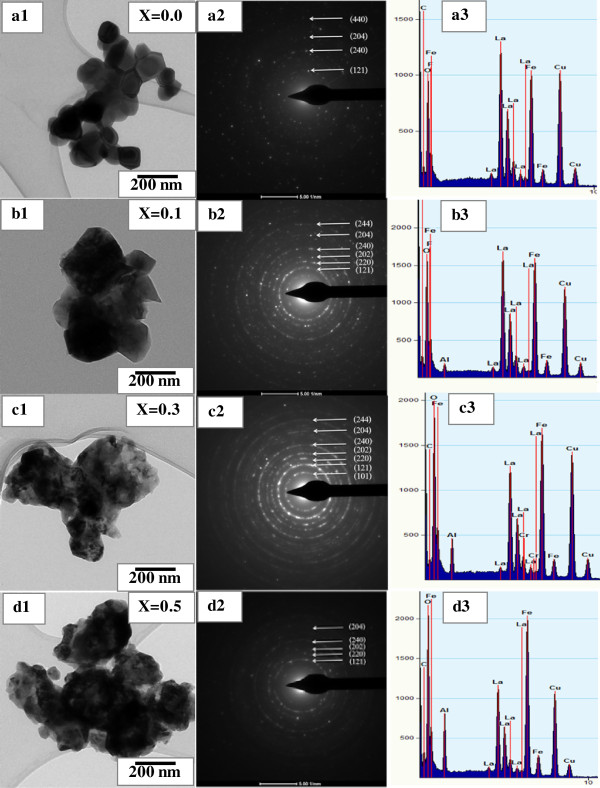
Bright-field TEM images (a1-d1) with the corresponding SAED patterns (a2-d2) and EDX spectra (a3-d3) of La1 − xAlxFeO3 nanopowders. (a)x = 0.0. (b)x = 0.1. (c)x = 0.3. (d)x = 0.5.

Bright-field TEM images (a1-d1) with the corresponding SAED patterns (a2-d2) and EDX spectra (a3-d3) of La1 − xAlxFeO3 nanopowders. (a)x = 0.0. (b)x = 0.1. (c)x = 0.3. (d)x = 0.5.