
Figure 3. Significantly mutated genes in non-hypermutated gastric cancer.
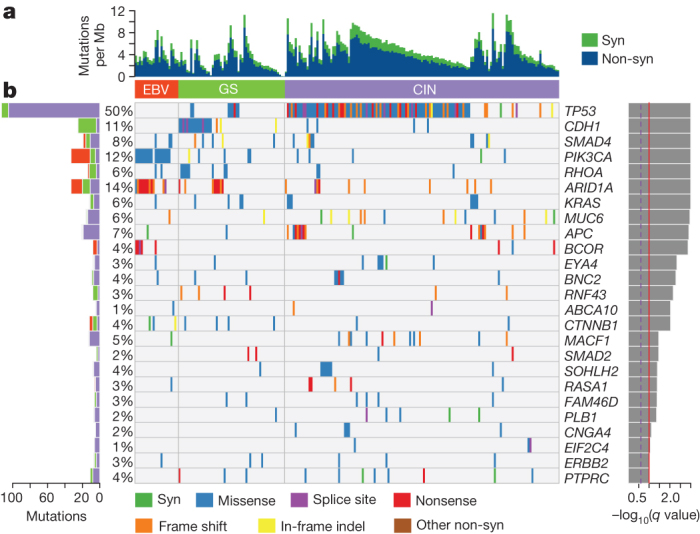
a, Bars represent somatic mutation rate for the 215 samples with synonymous and non-synonymous mutation rates distinguished by colour. b, Significantly mutated genes, identified by MutSigCV, are ranked by the q value (right) with samples grouped by subtype. Mutation colour indicates the class of mutation.