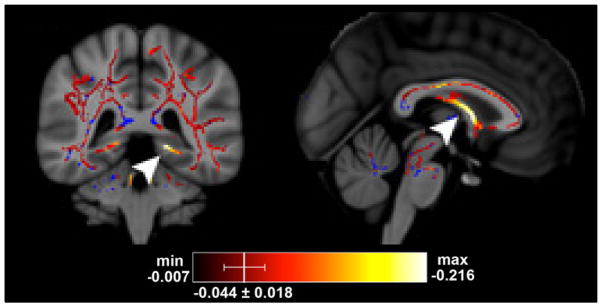
Fig 2.

Tract-based statistical analysis (TBSS) of diffusion tensor images in patients receiving whole brain radiation therapy. There was a significant decrease in FA in the left inferior cingulum (left) and fornix columns (right) from pre RT to end of RT. Hot colors indicate a significant decrease in FA on the TBSS skeleton, and blue represents the TBSS skeleton without significant changes.
