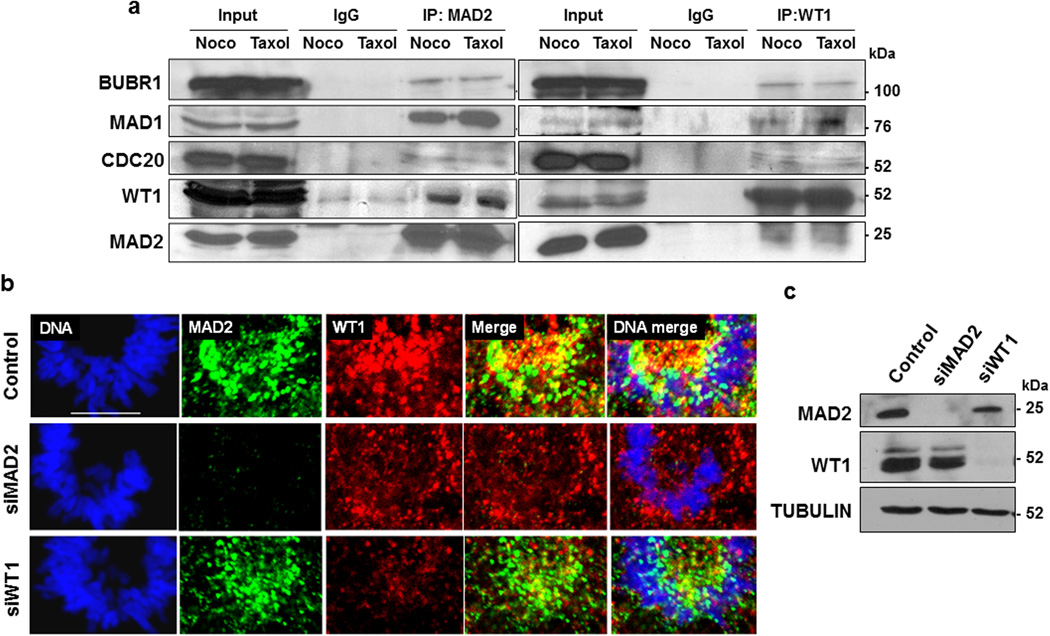
Figure 4. WT1 interacts with the mitotic checkpoint complex.
(a) K562 cells were treated with 60 ng/ml of either nocodazole or taxol. MAD2 and WT1-immunoprecipitates were analyzed by immunoblotting with the indicated antibodies. Input is 10% of the total whole cell extract used for immunoprecipitations. (b) WiT49 cells were transfected with control, MAD2 siRNA or WT1 siRNA for 48 hours followed by immunofluorescence analysis with anti-MAD2 and anti-WT1 antibodies in the pro-metaphase stage of mitosis. DNA was stained with Hoechst. The scale bar is 10 microns. (c) Immunoblotting was performed with anti-MAD2, anti-WT1 and anti-TUBULIN antibodies for control and MAD2 or WT1 siRNA transfected cells.

