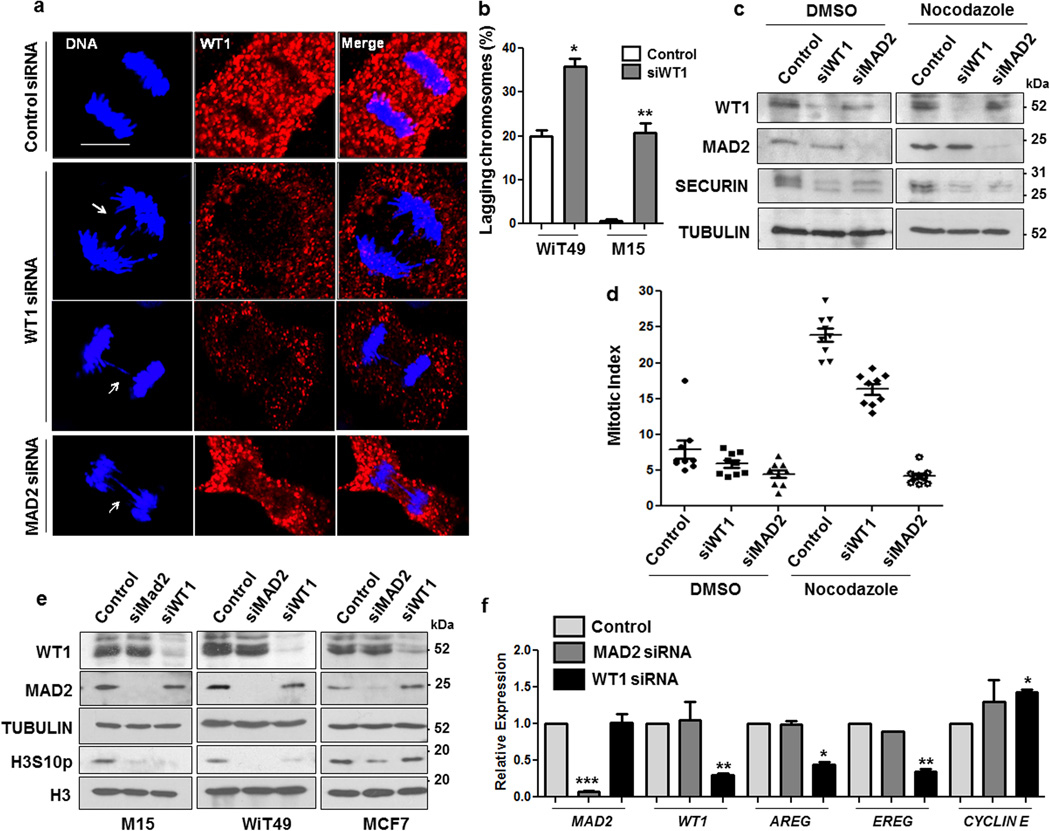
Figure 6. WT1 knockdown increases the rate of mitotic abnormalities.
(a) WiT49 cells were transfected with control, WT1, or MAD2 siRNA and 48 hours later immunofluorescence analysis was performed with anti-WT1 antibodies to study the anaphase stage of mitosis. DNA was stained with Hoechst. The scale bar is 10 microns. (b) The percentage of WiT49 and M15 cells exhibiting mitotic defects (chromosome lagging/bridges) was scored over total number of cells that were in anaphase for >100 optical fields and plotted graphically. Error bars are standard deviation from the mean for three independent experiments and statistical significance was determined by Student’s t test (P < 0.05). (c) WiT49 cells were transfected with control, WT1 or MAD2 siRNAs for 48 hours followed by treatment with either DMSO or nocodazole (60 ng/ml) for another 24 hours. Whole cell extracts were prepared and immunoblotted with anti-WT1, MAD2, SECURIN and TUBULIN antibodies (d) Mitotic indices were calculated for WiT49 cells transfected with control, WT1 or MAD2 siRNA followed by DMSO or nocodazole (60 ng/ml) treatment. The results were plotted as graphs after analyzing >100 optical fields for at least three independent experiments. Error bars are standard deviation from the mean. (e) M15, WiT49 and MCF7 cells were transfected with control, MAD2 or WT1 siRNAs for 48 hours followed by immunoblotting with anti-WT1, anti-MAD2, anti-TUBULIN, anti-phosphorylated Histone H3 serine10 (H3S10p) and anti-Histone H3 antibodies. (f) Quantitative RT-PCR analysis was performed to analyze the expression of MAD2, WT1, AREG, EREG and CYCLIN E genes in WiT49 cells transfected with control, MAD2 siRNA or WT1 siRNA for 48 hours. Error bars denote standard deviation from the mean of three independent experiments and statistical significance was analyzed by Student’s t test (P < 0.05).

