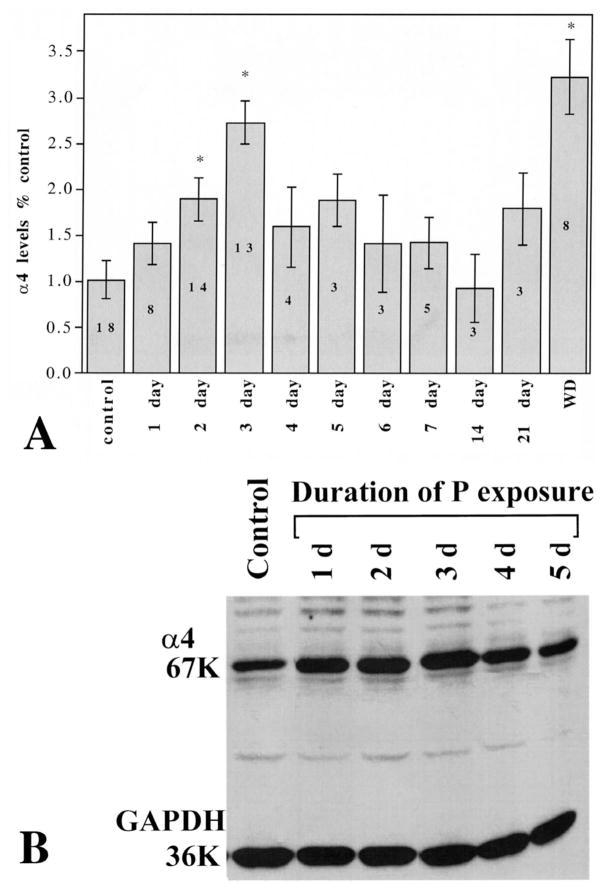
Fig. 1.
Time course of increases in α4 GABAR subunit levels after P capsule implantation. (A) Statistical analysis of the data is represented as the integrated optical density of the immunoreactive bands and is expressed as a ratio of the control condition. Asterisks above 2 day, 3 day and WD indicate a statistically significant (P<0.05) increase above control levels. The numbers inside the bars are the individual n for each condition in experiments that were performed in triplicate. (B) Representative Western blot of α4 immunoreactivity across the first 5 days of hormone exposure showing typical values for the 67-kDa α4 subunit band. The levels of the 36-kDa control protein, GAPDH, do not change during hormone treatment.

