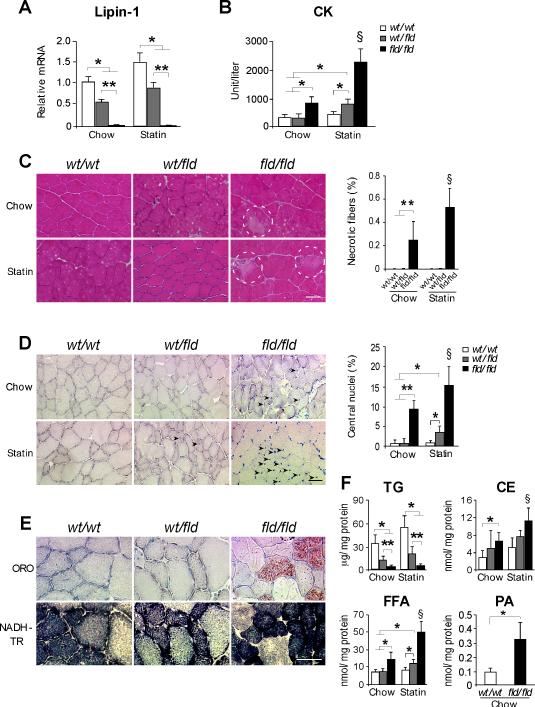
Figure 1. Myopathy in Lipin-1–deficient and Statin-treated Lipin-1–haploinsufficient Mice.
(A) Lpin1 mRNA levels in muscle of lipin-1–deficient (fld/fld), heterozygous (wt/fld), and wild type (wt/wt) mice (n = 6 mice/genotype).
(B) Plasma creatine kinase (CK) activity in mice fasted 16 h and refed for 5 h (n = 5-12 mice per group).
(C) Left, Representative image of necrotic myofibers (enclosed in dashed line circles) in transverse section of lower hindlimb muscle (H&E stain). Right, Necrotic myofiber frequency as a percentage of total fiber number (n = 5 mice per group). Scale bars in panels (C), (D) and (E) correspond to 50μm.
(D) Left, Representative image of centrally nucleated myofibers (arrowheads) in transverse section of lower hindlimb muscle (methyl Green stain). Right, Centrally nucleated myofiber frequency as a percentage of total fiber number (n = 5).
(E) Upper, Oil Red O (ORO)-stained sections from tibialis anterior muscle. Lower, NADH-tetrazolium reductase (NADH-TR) staining of sections adjacent to those stained with ORO. Lipid accumulation present in type I fibers (dark blue), but not type II fibers (light blue).
(F) Lipid quantification in lower hindlimb muscle from mice under basal and statin treated conditions. Measurements were made biochemically (TG, CE, FFA) or with electrospray ionization mass spectrometry (PA) (n = 3-6). TG, triacylglycerol; CE, cholesteryl esters, FFA, unesterified fatty acids; PA, phosphatidatic acid. *, p < 0.05; **, p < 0.01 vs. indicated group; §, p < 0.05, vs. all other groups.

