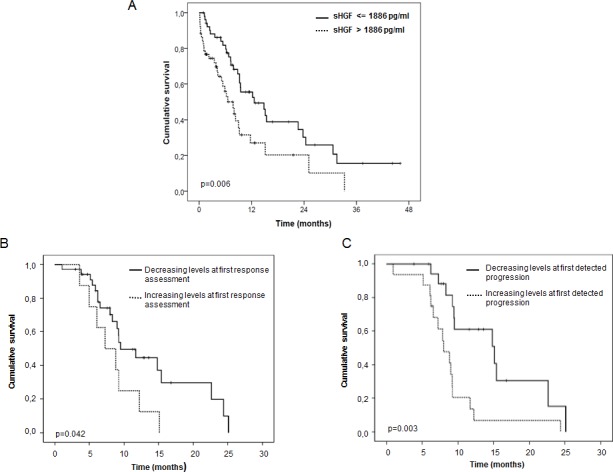
Figure 2. sHGF levels at diagnosis and changes during treatment are predictive of outcome in SCLC patients.

(A) Kaplan-Meier curve for overall survival according to baseline sHGF levels in SCLC patients. The median sHGF level at diagnosis (1886 pg/ml) was used as the cut-off. P-values were calculated using the log-rank test. Significance is displayed. (B) Kaplan-Meier curve for overall survival according to changes (increase vs decrease) in sHGF levels at response evaluation (first CT scan) in stage IV SCLC patients. P-values were calculated using the log-rank test. Significance is displayed. (C) Kaplan-Meier curve for overall survival according to changes (increase vs decrease) in sHGF levels at first clinically detected progression in stage IV SCLC patients. P-values were calculated using the log-rank test. Significance is displayed.
