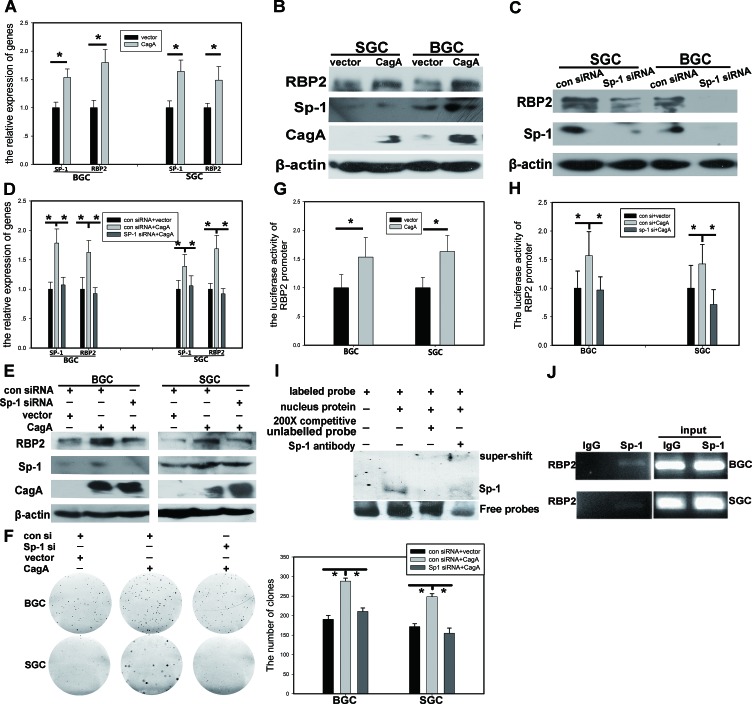
Figure 3. RBP2 expression induced by CagA is Sp1 dependent.
(A) and (B) RBP2 and Sp1 changes at RNA level and protein level with CagA transfection in GC cells was determined by QRT-PCR and western blot respectively. Data are mean±SD of 3 biological replicates, *: P <0.05 compared with negative control. (C) RBP2 and Sp1 protein changes with Sp1 siRNA treatment in GC cells. (D), (E) and (F) RBP2 and Sp1 changes at RNA level and protein level and foci formation with Sp1 siRNA and CagA treatment solely or jointly in GC cells. Data are mean±SD of 3 biological replicates, *: P <0.05 compared with negative control. (G) RBP2 promoter activity changes with CagA transfection in GC cells. Data are mean±SD of 3 biological replicates, *: P <0.05 compared with control. (H) RBP2 promoter activity changes with Sp1 siRNA and CagA treatment solely or jointly in GC cells. Data are mean±SD of 3 biological replicates, *: P <0.05 compared with control. (I) EMSA assay for the binding of Sp1 to RBP2 promoter. (J) ChIP assay for the binding of Sp1 to RBP2 promoter in GC cells.

