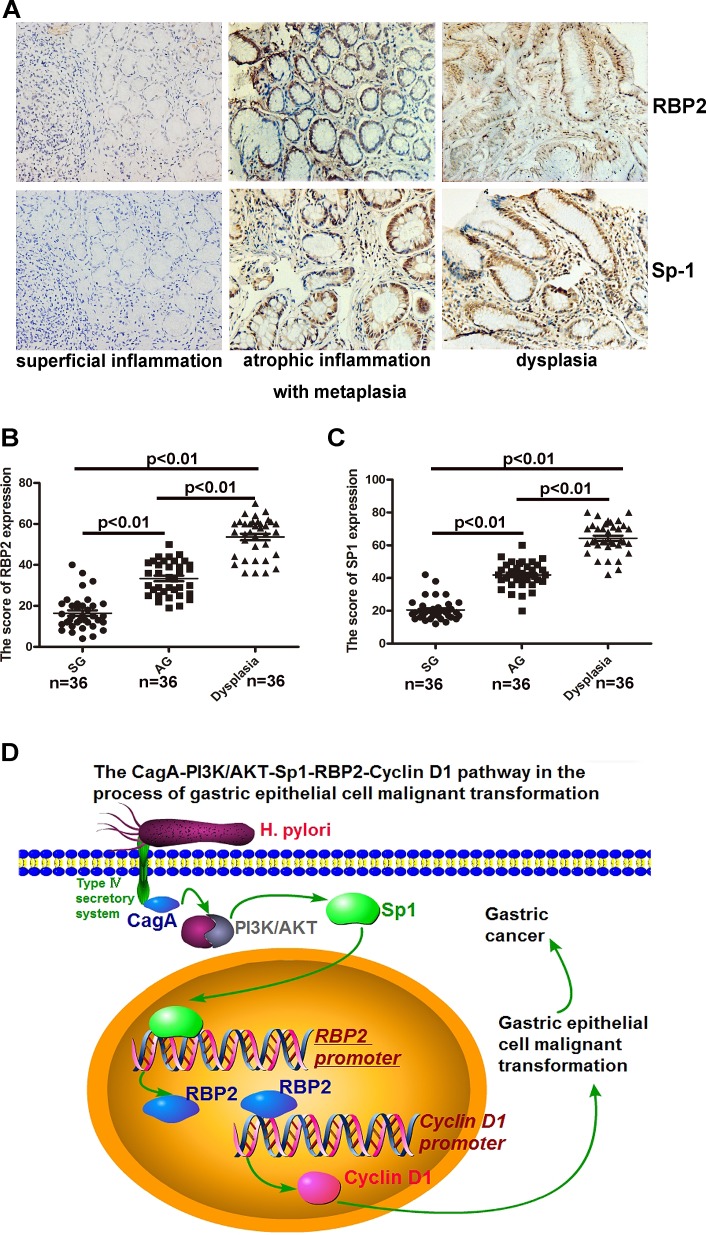
Figure 6. Co-expression of RBP2 and Sp1 expression in clinical samples from chronic inflammation to dysplasia.
(A) RBP2 and Sp1 expression in serial sections from tissues of clinical samples (chronic inflammation to dysplasia). Representative images are shown here. Original magnification, ×10. (B) and (C) A summary of RBP2 and Sp1 expression in the above tissues. (D) An outline of the main pathways illustrated in our work.

