
Figure 2. Venn diagrams showing the overlap of differentially expressed microRNAs identified from each of the three comparisons: invasive group versus control group, invasive group versus DCIS group, and DCIS group versus control group, respectively.
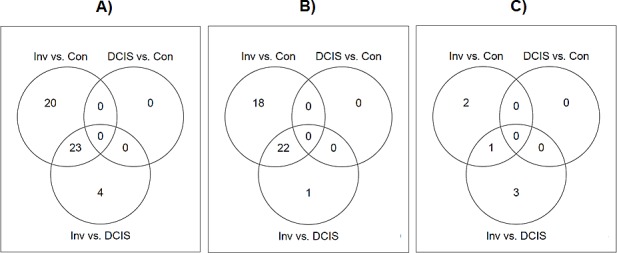
A) The overlap of all differentially expressed microRNAs; B) The overlap of up-regulated differentially expressed microRNAs; C) The overlap of down-regulated differentially expressed microRNAs.