
Figure 3. Elevated serum level of of miR-133a and mir-148b in invasive group versus control group of validation cohort.
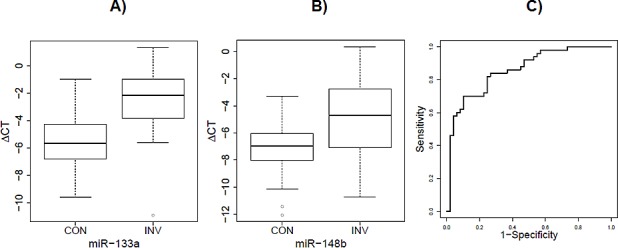
A) The fold change of mir-133a was 8.3 (P = 1.3×10⁻¹⁰) in the validation cohort. B) The fold change of mir-148b was 5.1 (P = 1.5×10⁻⁶) in the validation cohort. C) The ROC curve derived from the combinations of these two miRNAs (AUC = 0.86) in the validation cohort.