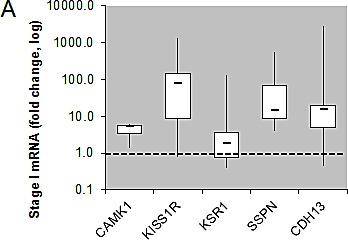
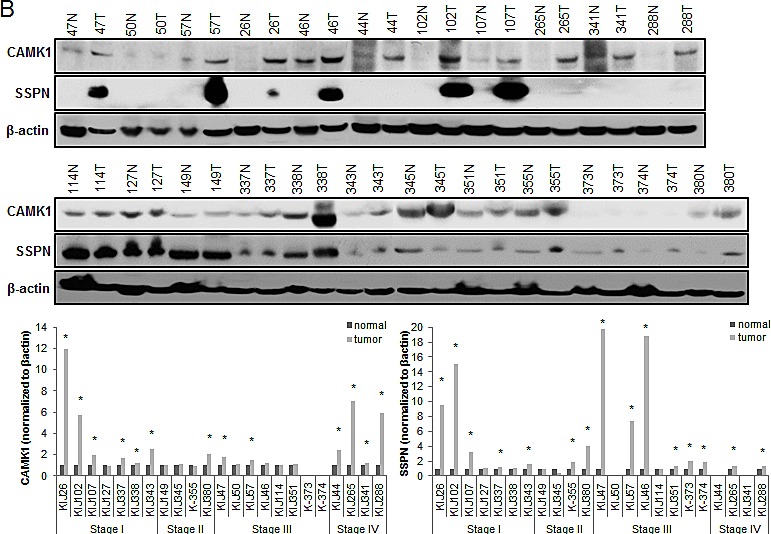
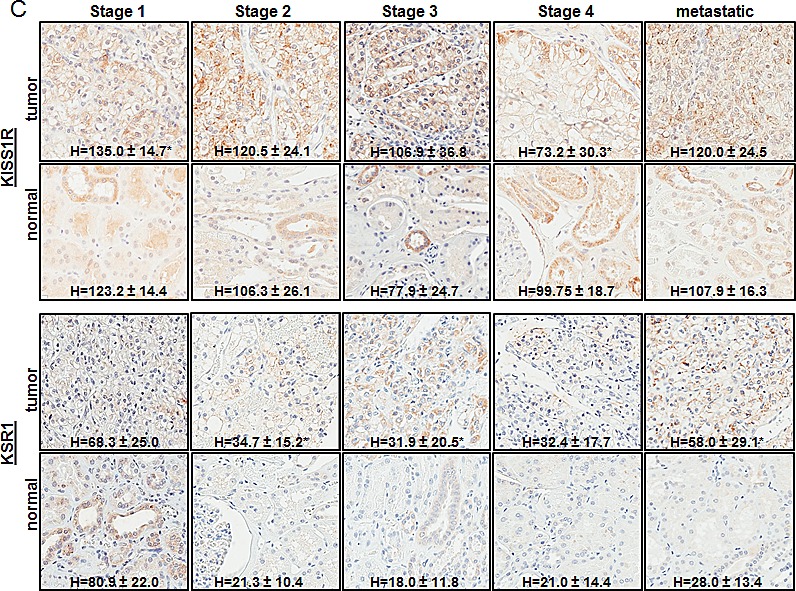
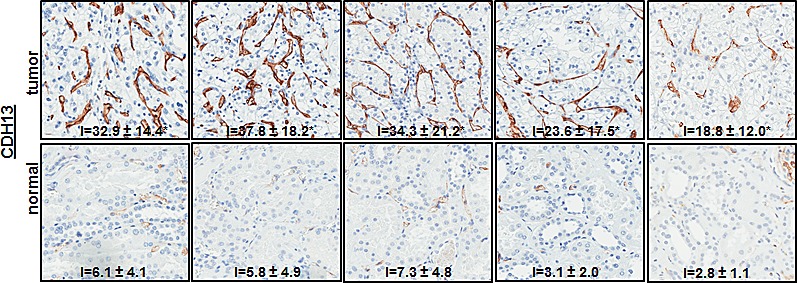
Figure 3. Functional Validation of tumor specific expression of a subset of hits identified in RCC.


(A) Box whisker plot of QPCR evaluating CAMK1, KISS1R, KSR1, SSPN, and CDH13 mRNA expression in stage I patient tumor and matched normal samples (n=8 for each normal and tumor samples). Results are shown as tumor fold change induction vs. normal samples, where the dashed line represents normal tissue expression. (B) Western blot for CAMK1 and SSPN in protein lysates derived from stage I-IV patient tumor and matched normal samples. Protein levels are quantitated against β-actin loading control, and tumor samples are normalized against matched normal samples which are set at 1. Samples are further sorted by stage, and tumors that demonstrate over a 20% increase in expression vs. matched normal are considered to be significantly overexpressed(*). (C) IHC of patient tissue microarrays for protein expression of KISS1R (normal n=40, 24, 25, 6, 9 and tumor n=36, 15, 23, 6, 20 for stages I, II, III, IV, and metastasis, respectively), KSR1 (normal n=53, 34, 34, 8, 8 and tumor n=42, 21, 23, 6, 24 for stages I, II, III, IV, and metastasis, respectively), and CDH13 (normal n=53, 29, 33, 8, 9 and tumor n=40, 19, 22, 8, 19 for stages I, II, III, IV, and metastasis, respectively). Representative tumor and normal images as well as mean H-scores ± standard deviation are shown for KISS1R and KSR1; mean I-scores ± standard deviation are shown for CDH13. Asterisk indicates values of statistically significant increases in tumor samples (where p≤0.05).
