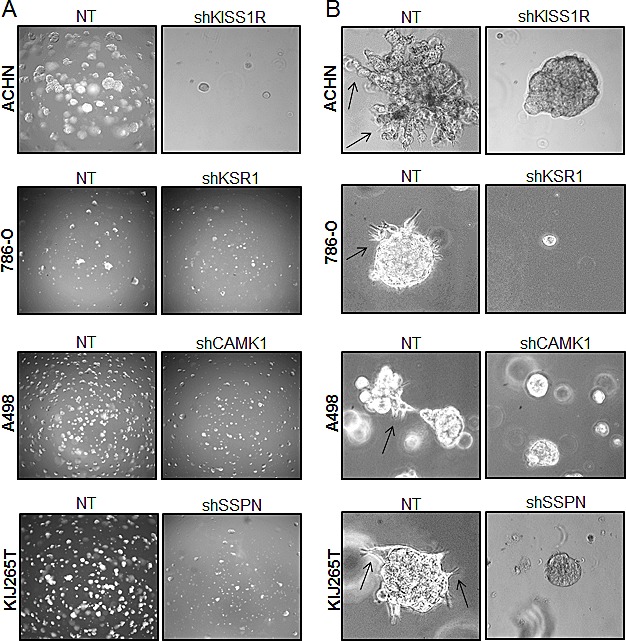
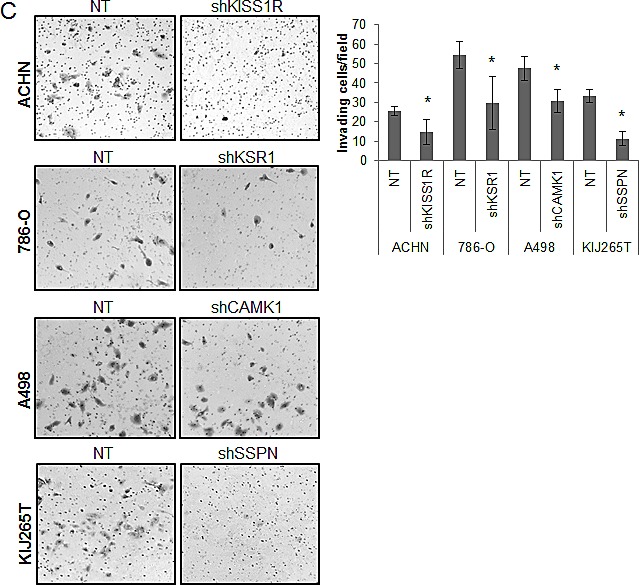
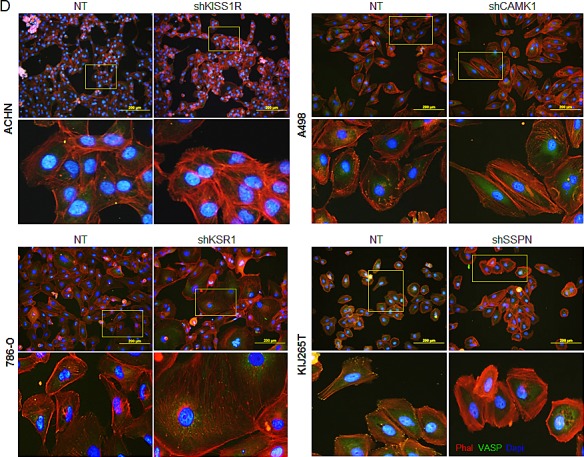
Figure 5. Decreased KISS1R, KSR1, CAMK1, and SSPN expression results in loss of invasive phenotype in ccRCC cells.


(A) Images represent 10x magnification of NT and specified hit knockdown cells plated in a 3D matrix after 10 days of growth. (B) 40x manual magnification of representative colonies of NT and target hit knockdown cells grown in 3D cell culture assays at day 10. Stellar outgrowth is seen in NT populations and is indicated by black arrows. (C) Invasion assays of NT and target hit knockdown cells. Representative 10x images of transwell inserts from invasion chambers are shown. Invasion is quantitated as number of invading cells per visual field (n=3). (D) Immunofluorescence for phalloidin, VASP, and dapi (nuclear stain) in NT and hit target knockdown cells. Top panels for each cell line are 20x magnification. Highlighted areas magnified manually, and are shown directly below panel of origin.
