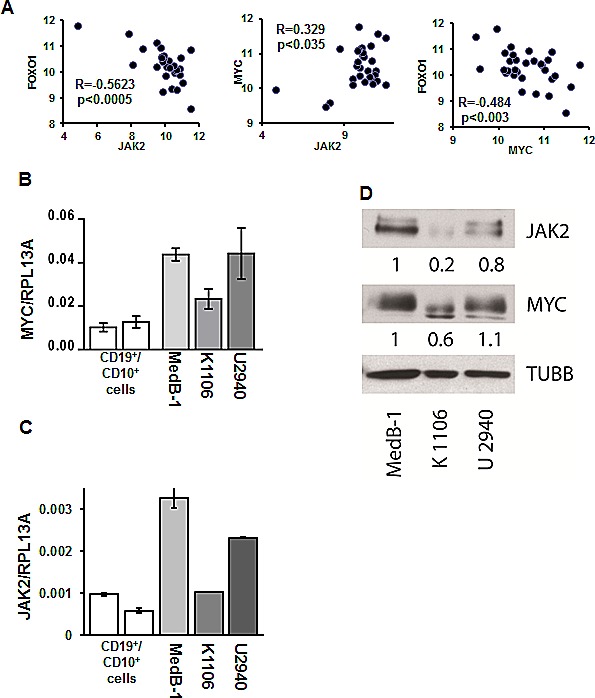
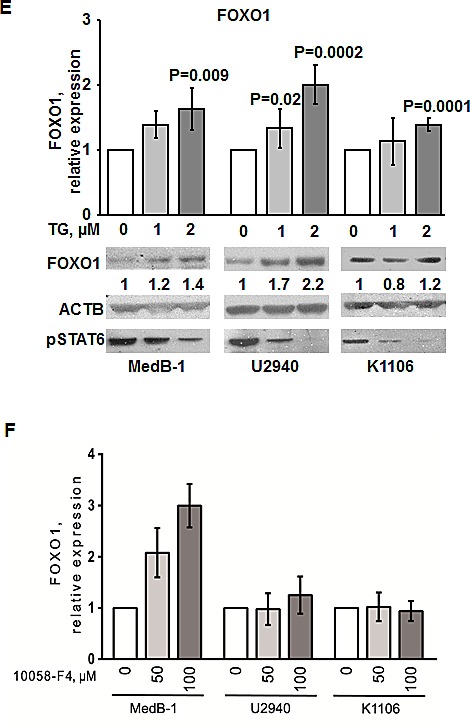
Figure 4. JAK2 and MYC contribute to FOXO1 repression in PMBL.


(A) FOXO1 expression negatively correlates with MYC and JAK2 mRNA levels in PMBL samples. The data of 31 PMBL cases were mined from GEO database (GSE11318). We used following probe sets for correlation analysis: FOXO1 - 202724_s_at; JAK2 - 205842_s_at; MYC - 202431_s_at. The criteria for the chosen probe sets are described in “Material and Methods”. The data are shown as log2 of fluorescence intensity. Expression of MYC (B) and JAK2 (C) in PMBL cell lines was measured by Q-RT-PCR. The data are shown as ratio to the reference gene RPL13A. (D) Expression of JAK2 and MYC protein in PMBL cell lines was analyzed by immunoblot. JAK2 and MYC expression was normalized to MedB-1 cells. (E). PMBL cell lines were treated for 24 h with the JAK2 inhibitor TG101348. FOXO1 expression was measured by Q-RT-PCR and by immunoblot. Statistical analysis was done by a two-way t-test. FOXO1 expression in the control group was compared with groups treated with increasing concentrations of the inhibitor. For immunoblot ACTB was used as a loading control. To control repression of JAK2 activity we used anti-phospho-STAT6 antibody. (F) PMBL cell lines were incubated with the MYC inhibitor 10058-F4 for 24h. FOXO1 expression was measured by Q-RT-PCR. The data were analyzed by comparative Ct method.
