
Figure 1. Scatter plots of quantitative methylation values of all the 8 genes tested in recurrent (R, n=19) and non-recurrent (NR, n=17) primary urothelial cell carcinoma (UCC) samples.
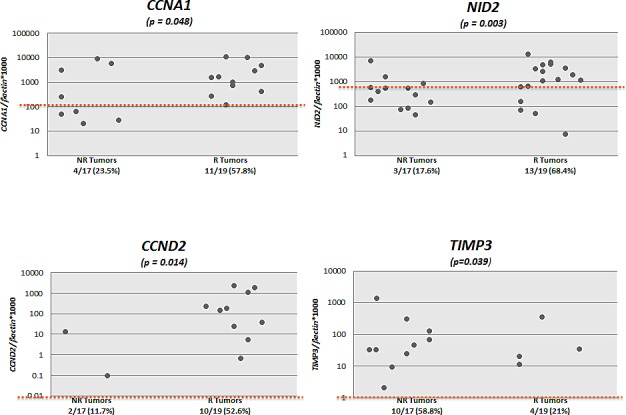
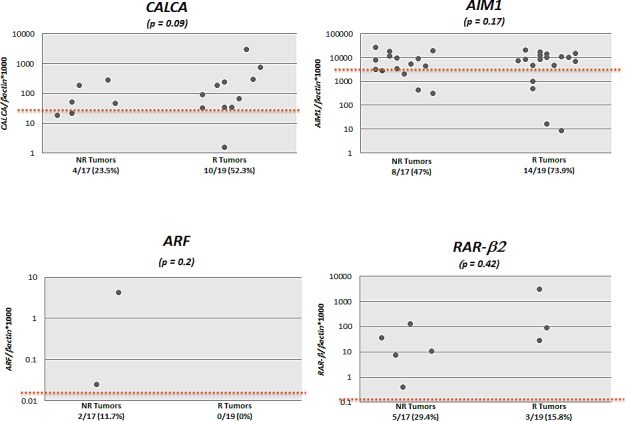
Calculation of the gene of interest/β-actin ratios was based on the fluorescence emission intensity values for both the gene of interest and β-actin obtained by quantitative real-time PCR analysis. The obtained ratios were multiplied by 1,000 for easier tabulation. Zero values cannot be plotted correctly on a log scale.