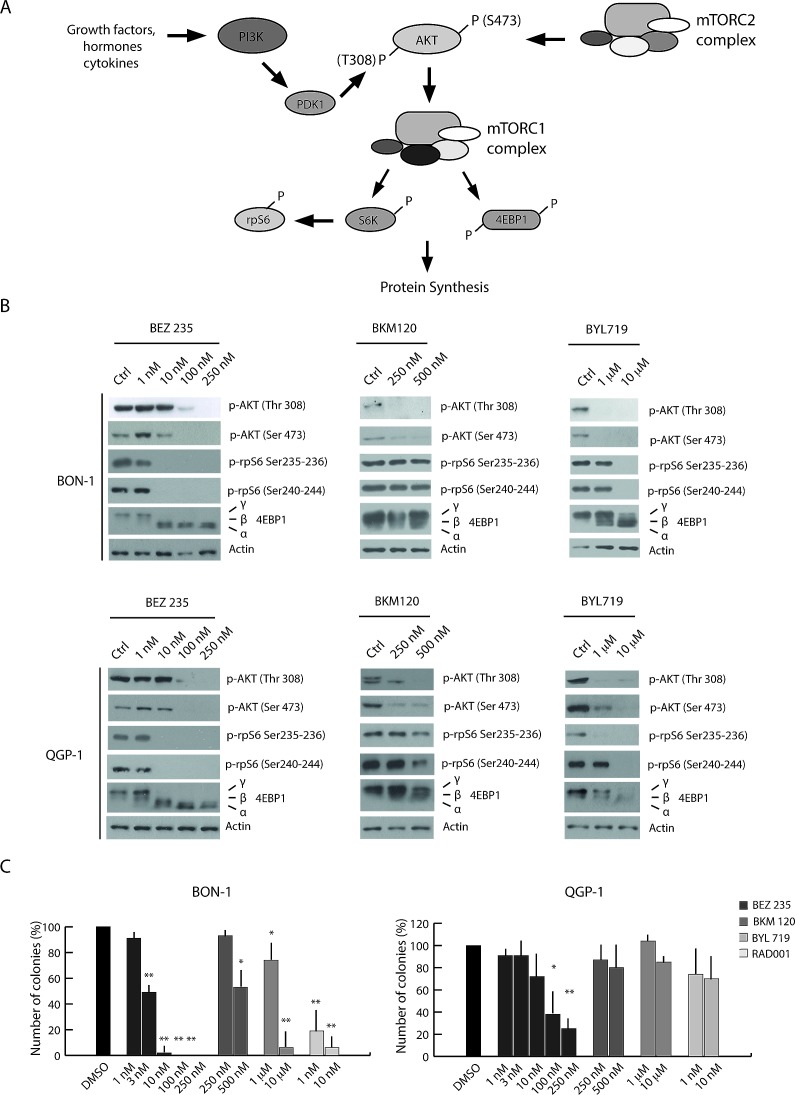
Figure 2. PI3K inhibitors display different efficacy in the inhibition of PET cell growth.
(A) Schematic representation of the PI3K/Akt/mTOR pathway. (B) Western blot analysis of 4EBP1, p- AKT Ser 473, p-AKT Thr 308, p-rpS6 Ser 240-244 and p-rpS6 Ser 235-236 in BON-1 and QGP-1 treated with the PI3K inhibitors BEZ235, BKM120 and BYL719 for 4 hours. Actin was used as loading control. (C) Colony formation assays performed in BON-1 and QGP-1 treated with the PI3K inhibitors and RAD001. Histograms show the percentage of inhibition of colony formation in comparison to control cells from three experiments (mean ± s.d.). Statistical analysis was performed by the paired Student's t-test; * P ≤ 0.05, ** P ≤ 0.01.

