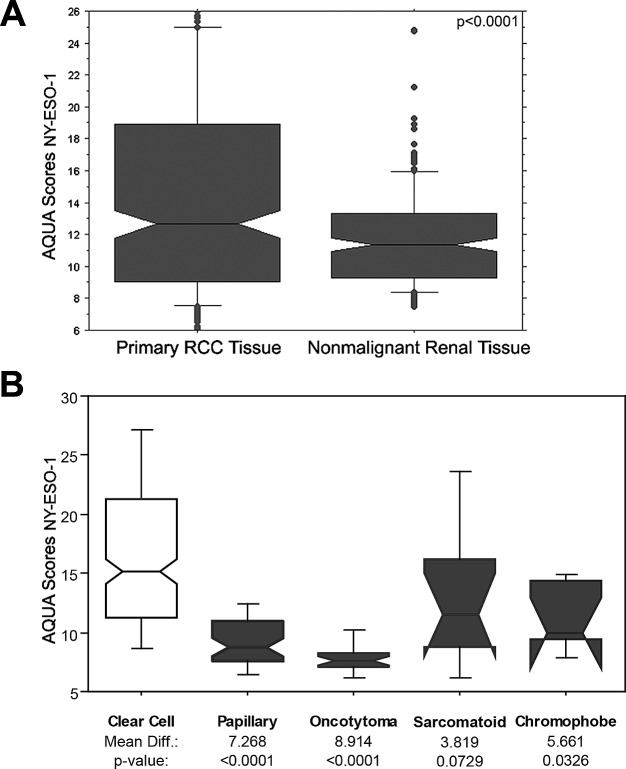
Figure 2. NY-ESO-1 expression in primary and nonmalignant renal specimens and in different histologic subtypes.
(A) Box plots representing the AQUA scores for NY-ESO-1 expression levels in primary RCC tumor and nonmalignant renal tissue. The horizontal bars correspond to the 5th, 50th and 95th percentiles. Primary RCC tumors has a significant higher NY-ESO-1 expression levels than corresponding nonmalignant renal tissue (p<0.0001). (B) Box plots representing AQUA scores in the various histologic subtypes showing higher expression in clear cell carcinomas than papillary RCCs, chromophobe tumors and oncocytomas.

