
Figure 3. NY-ESO-1 expression in matched primary and metastatic specimens.
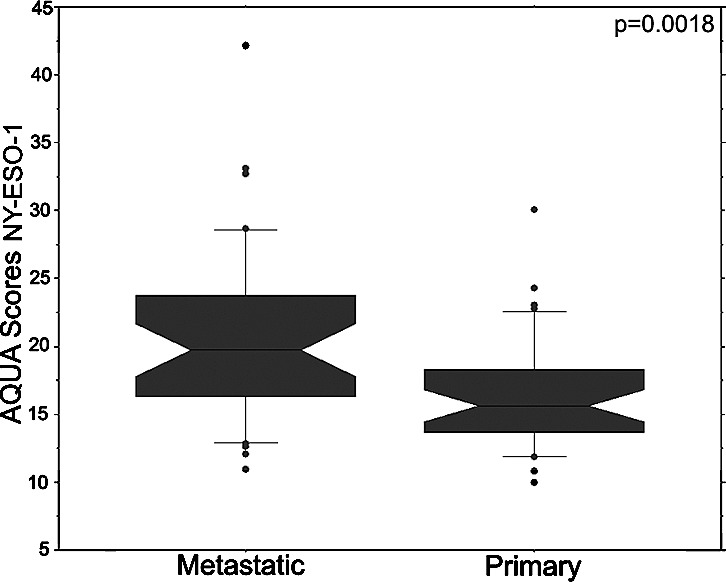
Box plots show NY-ESO-1 expression in matched primary and metastatic specimens from the same patients. Metastatic specimens have significantly higher NY-ESO-1 expression than the primary specimens (p=0.0018).