
Figure 4. Estimates of NY-ESO-1 heterogeneity.
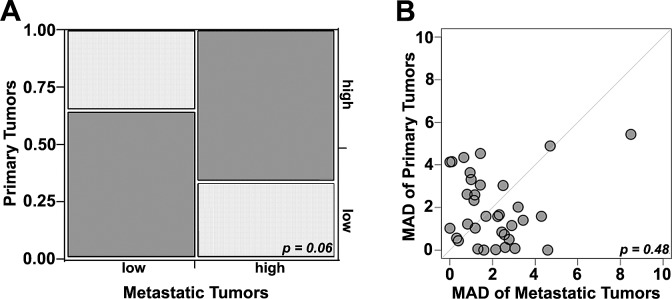
A)Chi-Sqare analysis comparing high and low NY-ESO-1 levels in matched primary and metastatic samples: Concordance (dark grey) was seen in 66% of cases while discordance (light grey) was seen in 34% (χ2 = 3.5, p=0.06). B) Comparison between heterogeneity within primary and metastatic specimens was estimated using a composite median absolute deviation (MAD). Each patient is represented by a dot. Dots above the diagonal represent patients with larger heterogeneity in the primary tumors, while dots below the diagonal represent greater heterogeneity in the corresponding metastatic tumors. The central diagonal grey line represents identical heterogeneity in primary and metastatic tumors. The Wilcoxon paired, two-sided signed rank test shows no significant difference between the heterogeneities of the primary and matched metastatic tumors (p = 0.48).