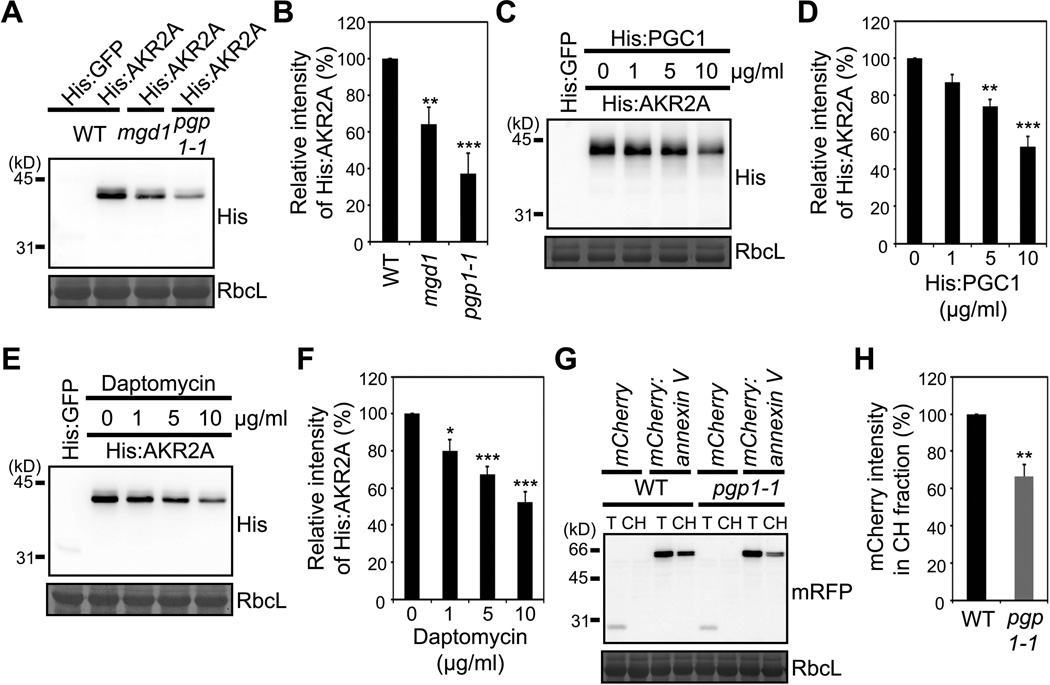
Figure 3. Chloroplast binding of AKR2A is impaired in mgd1 and pgp1-1 mutants.
(A and B) His:AKR2A binding to chloroplasts from WT, mgd1 or pgp1-1 plants. (A) Western blot analysis of His:AKR2A bound to chloroplasts using anti-His antibody. RbcL, loading control stained with Coomassie blue. (B) Quantification of His:AKR2A binding to mgd1, pgp1-1 or WT chloroplasts. Mean ± SD are shown (n = 3).
(C and D) The effect of the yPGC1 treatment to chloroplasts on AKR2A binding. (C) His:AKR2A binding to chloroplasts was examined as in (A) except that chloroplasts had been treated with His:yPGC1 before its use in binding experiments. (D) Quantification of His:AKR2A binding to His:yPGC1-treated chloroplasts. Mean ± SD are shown (n = 3).
(E and F) Effect of daptomycin on AKR2A binding to chloroplasts. (E) His:AKR2A binding to chloroplasts was examined as in (A) except that chloroplasts had been treated with daptomycin before its use in binding assay. (F) Quantification of His:AKR2A binding to daptomycin-treated chloroplasts. Mean ± SD are shown (n = 3).
(G and H) The binding of annexin V to chloroplasts. (G) mCherry:annexin V or mCherry alone was introduced into protoplasts and chloroplast fractions from the transformed protoplasts were analyzed by Western blotting using anti-RFP antibody. mCherry alone was used as a control for fractionation. T, total protoplast extracts; CH, chloroplast fractions. (H) Quantification of the chloroplast-bound mCherry:annexin V. Mean ± SD are shown (n = 3). The asterisks indicate a significant difference from the corresponding control experiment by Student’s t-test (*P < 0.05; **P < 0.01; ***P < 0.001). See also Figure S2.

