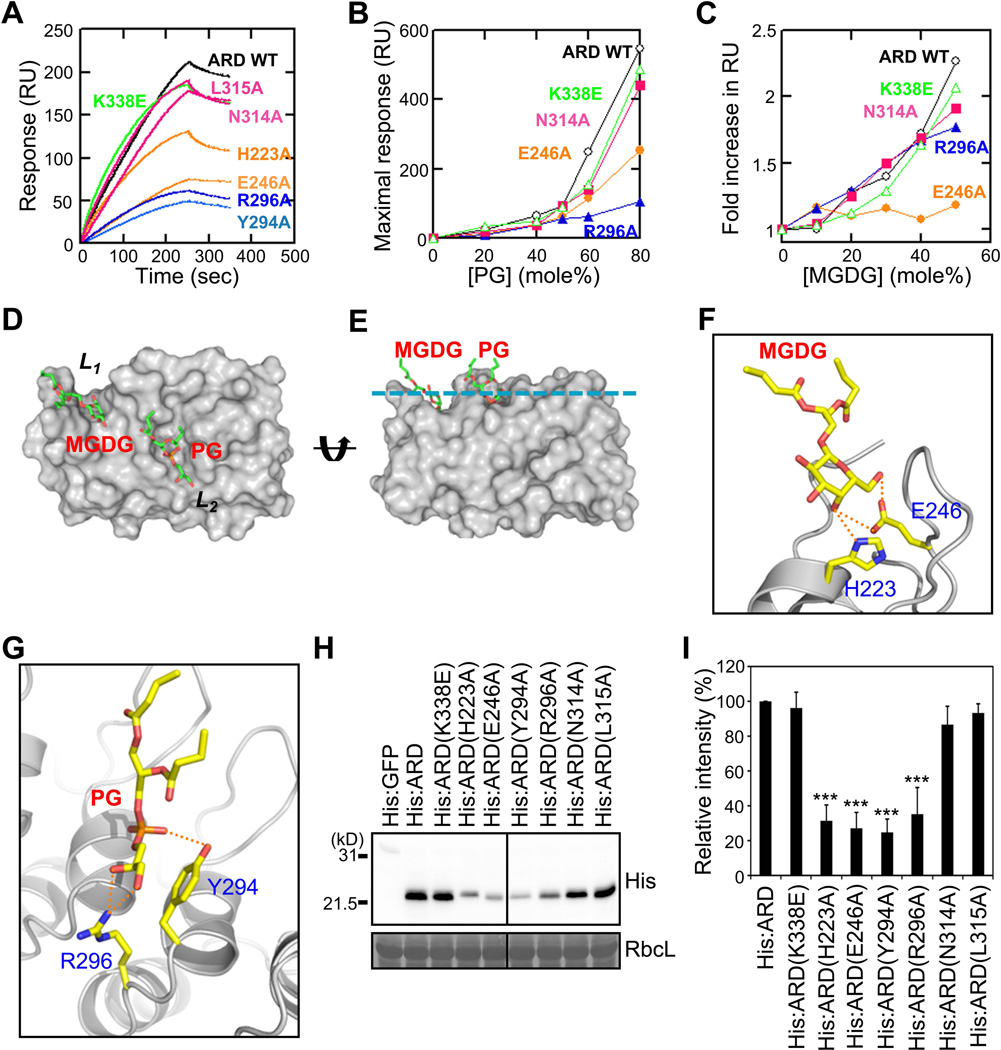
Figure 6. Identification of the MGDG- and PG-binding sites of the AKR2A ARD.
(A) SPR sensorgrams of ARD mutants interacting with POPC/POPG (50:50) vesicles.
(B) Measurement of the PG-dependent vesicle binding of the ARD mutants with POPC/POPG [(100−x):x] vesicles and maximal binding response values plotted against PG concentration.
(C) The MGDG-dependent vesicle binding of the ARD mutants. Maximal response values for ARD mutants interacting with POPG/POPC/MGDG [50:(50−x):x] vesicles measured at each MGDG concentration. Mutants in each group (L1, L2 and L3) show similar properties; thus, data for a representative mutant for each group (E246A for L1, R296A for L2, and N314A for L3) are shown in B and C for clarity. L1, L2, L3 site mutants are represented by orange, blue, and magenta, respectively. For SPR data, each point represents the average of triplicate measurements. RU, resonance unit. n = 3.
(D and E) A modeled structure of the ARD-PG-MGDG complex in two different orientations. (D) The ARD is shown in the same molecular orientation as in Figure 6C. (E) The structure is horizontally rotated 90° to show its membrane binding orientation. The cyan line indicates the putative membrane surface.
(F) Predicted hydrogen bonds between the MGDG headgroup and two key residues, H223 and E246, in the L1 pocket are shown as green dotted lines.
(G) Potential hydrogen bonds between the PG headgroup and two key residues, Y294 and R296, in the L2 pocket are shown as green dotted lines. The ternary complex model is identical to that shown in Figure 6D and 6E. The molecular orientations are arbitrarily selected for the best illustration of potential interactions. Although two key residues are shown for each site, many other protein residues can also participate in short-range interactions with lipid headgroups and acyl chains. Lipids are in stick representation and proteins in ribbon representation.
(H) Chloroplast binding of ARD and L1, L3, and L3 site mutants (see Figure 5C). RbcL, loading control.
(I) Chloroplast binding of L1, L3, and L3 site mutants was presented as relative values to that of His:ARD. Mean ± SD are shown (n = 3). The asterisks indicate a significant difference from the corresponding control experiment by Student’s t-test (*P < 0.05; **P < 0.01; ***P < 0.001). See also Figure S4.

