
Figure 2. Linkage disequilibrium (LD) between SNPs in the CX3CR1 gene.
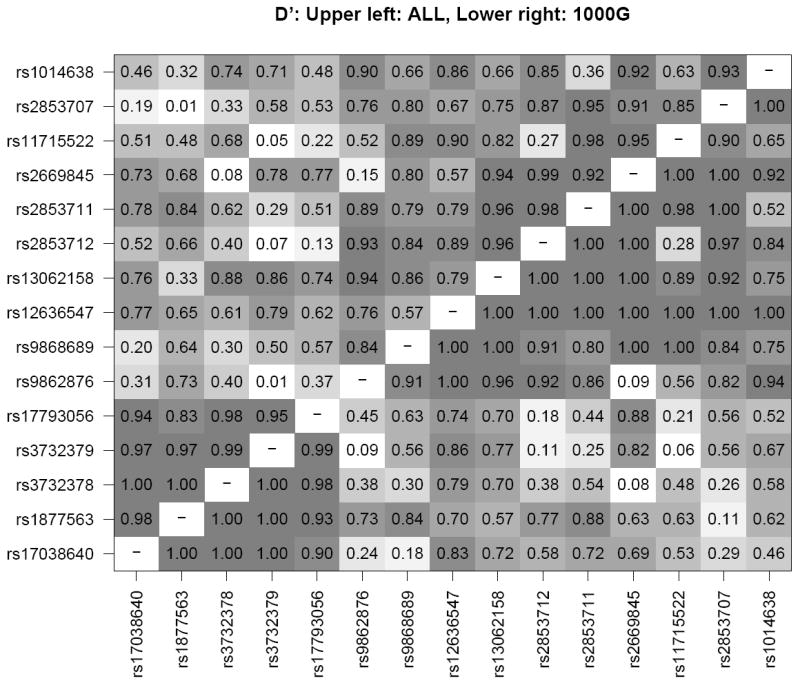
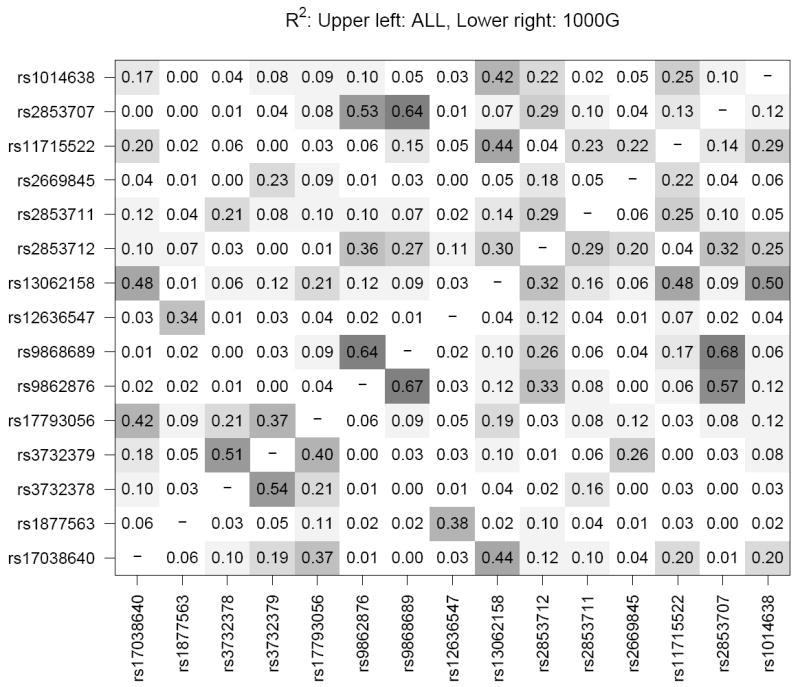
R2 and D’ LD measures were calculated using Haploview32 for the combined case/control samples from 5 study populations (WHS, PHS, WAFACS, NHS, HPFS). In each panel, the upper left triangle shows LD for the study sample while the lower right triangle shows LD for the same SNPs in the 1000 genomes European panel (381 individuals, release 11/23/2010) for comparison.55 Shading corresponds to the superimposed numeric estimates of LD for each pair of SNPs.