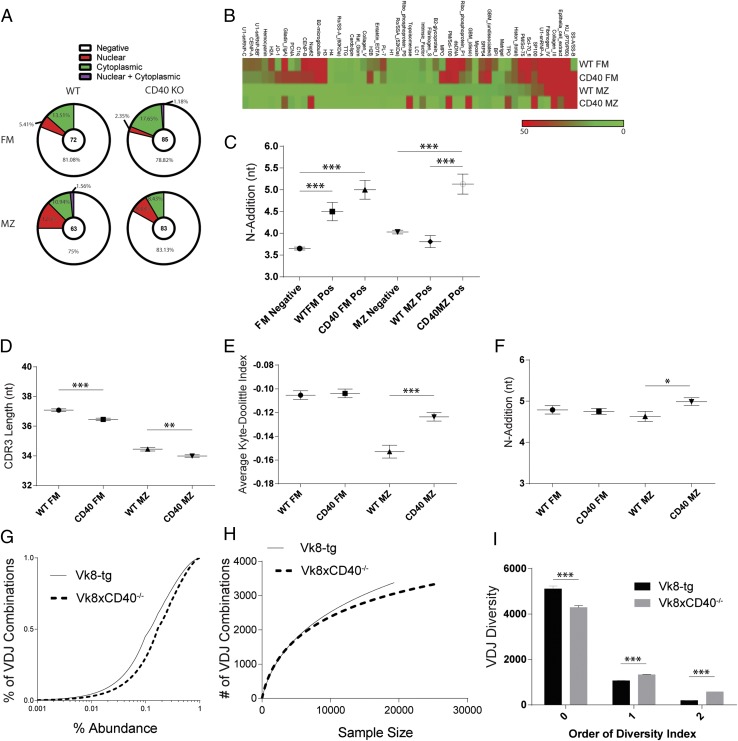
FIGURE 5.
Molecular characteristics and specificity profiles of the naive BCR repertoire in WT and CD40 KO mice. (A) Relative frequency of each ANA-IFA pattern in cloned BCRs, with total number of Abs evaluated for each subset shown in center of pie charts. (B) Autoantigen array data generated using Abs derived from WT versus CD40 KO FM and MZ cells. 60 Abs at equal concentration were pooled for each subset and normalized signal intensities plotted for each Ag. (C) BCR IgH sequence characteristics, specifically N-1 addition of cloned rAbs. Total number of BCR clones sequenced are 54 FM negative, 18 WT FM positive, 23 CD40 KO FM positive, 41 MZ negative, 22 WT MZ positive, and 22 CD40 KO MZ positive. (D–F) High-throughput BCR H chain sequencing of FM and MZ subsets sorted from WT and CD40 KO mice and 90:10 CD40 KO:WT mixed bone marrow chimeric mice. Analysis includes CDRH3 length of WT and CD40 KO mice (D), average Kyte–Doolittle hydrophobicity index (E), and N-1 addition of sorted subsets in mixed BM chimeras (F). (G–I) BCR diversity analyzed by sequencing splenic B cells derived from Vk8-Tg versusVk8-CD40−/−-Tg mice showing empirical cumulative distribution function for VDJ combination frequencies in Vk8-Tg and Vk8CD40−/− B cells (G), individual rarefaction demonstrating the approach to saturation of VDJ combinatorial diversity as sequencing depth increases (H), and diversity index calculations using SPADE (I). Error bars show SEM. Data representative of at least two experiments. *p < 0.05, **p < 0.005, ***p < 0.0005.

