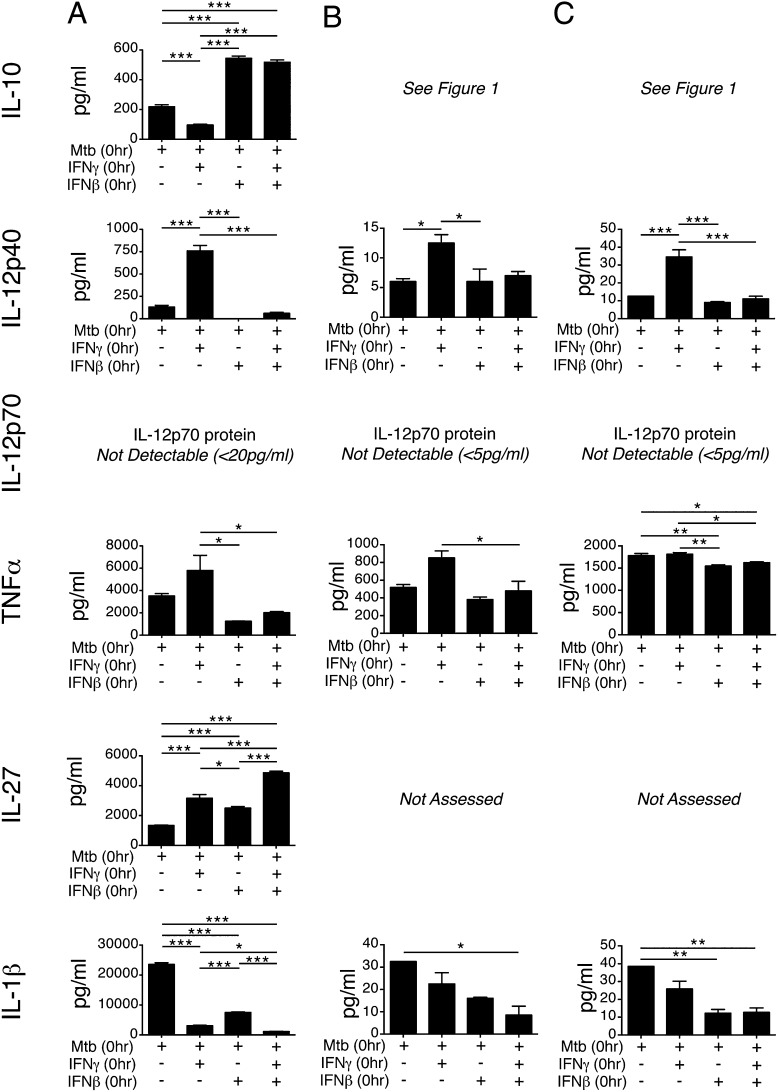
FIGURE 4.
Exogenous IFN-β inhibits M. tuberculosis–infected macrophage responsiveness to concomitant IFN-γ addition. (A) WT macrophages were infected with M. tuberculosis alone or with M. tuberculosis and IFN-β (2 ng/ml), M. tuberculosis and IFN-γ (5 ng/ml), or M. tuberculosis and both IFN-β (2 ng/ml) and IFN-γ (5 ng/ml) together, added at the time of infection. Cytokine levels in culture supernatants were determined at 24 h postinfection. Uninfected control samples were below the detection limit (20 pg/ml) for the cytokines measured (data not shown). Graphs show means ± SEM. Significance was determined using a one-way ANOVA with a Bonferroni post hoc test. Data are representative of three independent experiments. (B) Myeloid cells (Lin−Ly6c+Ly6G−) were sorted from the lungs of WT mice and infected with M. tuberculosis and treated with IFN as in (A). Cytokine levels in culture supernatant were determined at 24 h postinfection using a Luminex bead array. Uninfected control samples were below the detection limit (5 pg/ml) for the cytokines measured (data not shown). Graphs show means ± SEM. Data are representative of two independent experiments. (C) Myeloid cells (Lin−Ly6c+Ly6G−) were sorted from the BM of WT mice and infected with M. tuberculosis and treated with IFN as in (A) and (B). Cytokine levels in culture supernatant were determined at 24 h postinfection using a Luminex bead array. Uninfected control samples were below the detection limit for the cytokines measured (data not shown). Graphs show means ± SEM. Data are representative of three independent experiments. *p < 0.05, **p < 0.01, ***p < 0.001.

