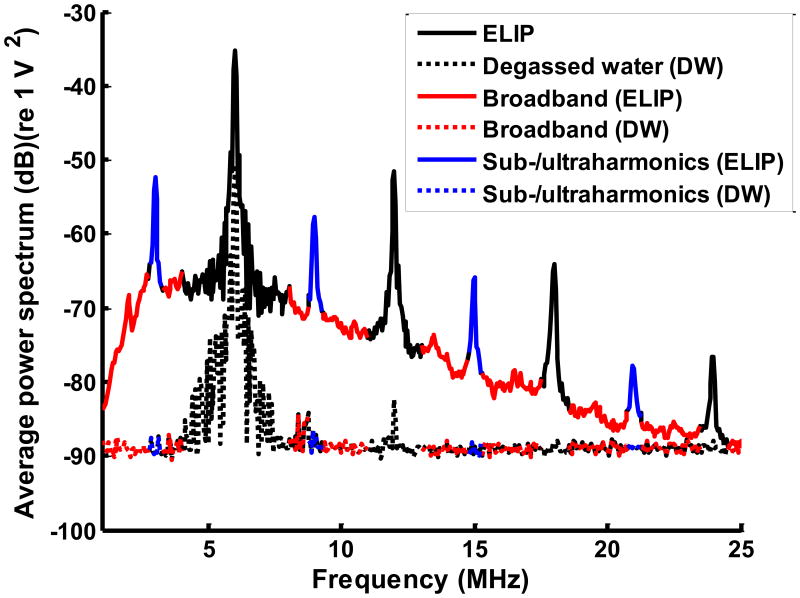
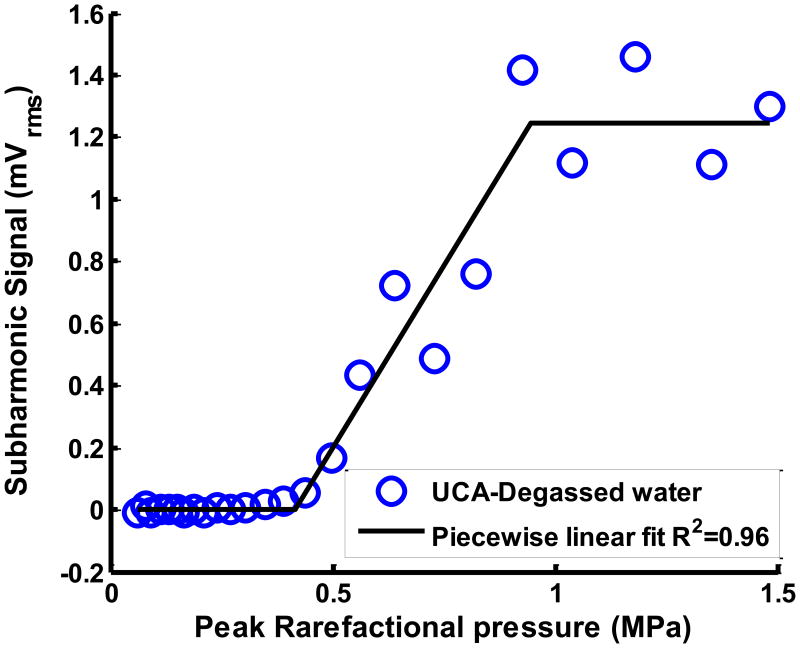
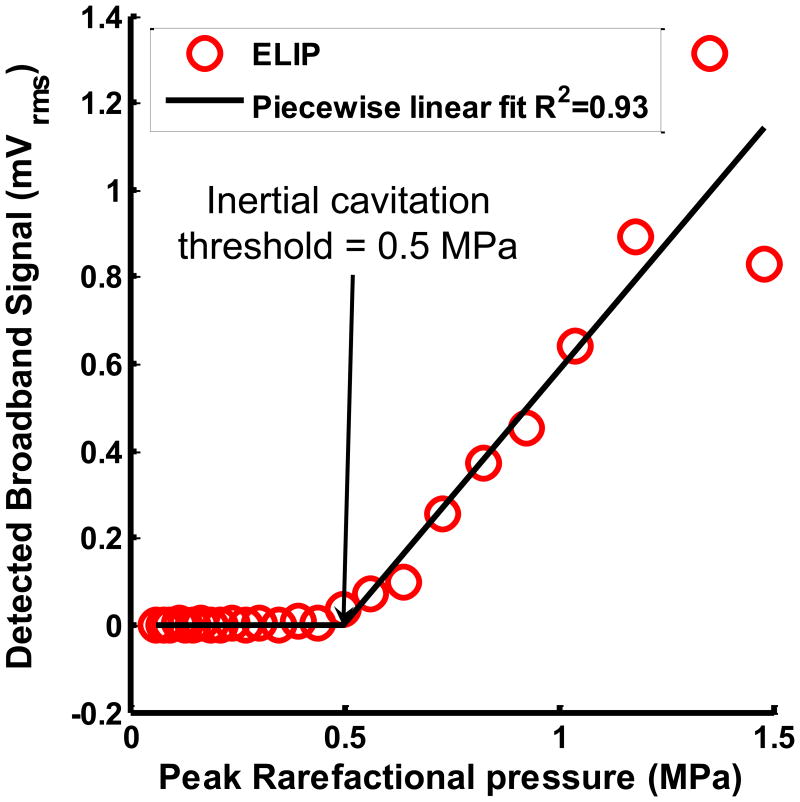
Figure 2.
(a) Example of cavitation spectrum from ELIP (solid line) and degassed water (DW) (dotted line). The blue bands indicate the sub- and ultraharmonics (centered at 3, 9, 15, 21 MHz). The red bands indicate the inharmonic bands or broadband at frequencies outside the fundamental (6 MHz), harmonics (12, 18 and 24 MHz) and sub- and ultraharmonics. (b) Example of subharmonic emissions from ELIP as a function of insonation peak rarefactional pressures. A three-segment piecewise linear fit was performed and the inflection between the first two segments was defined as the stable cavitation threshold. (c) Example of broadband emissions from ELIP as a function of insonation peak rarefactional pressures. A two-segment piecewise linear fit was performed and the inflection between the two segments was defined as the inertial cavitation threshold.


