
Figure 3.
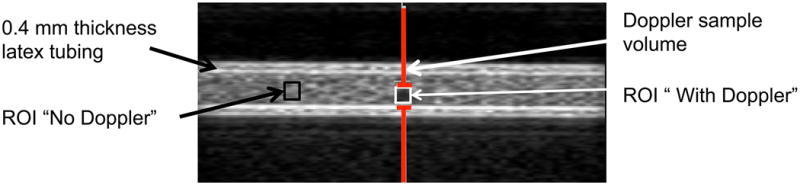
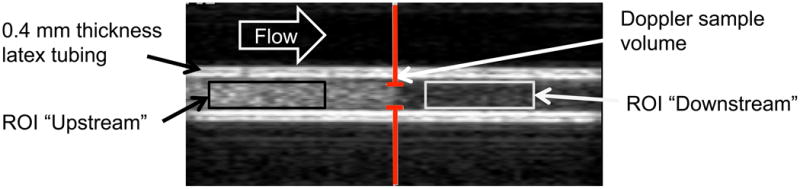
(a) Example of ELIP in the 0.4 mm thick latex tubing with no flow. The gray bars indicate the location of the Doppler “sample volume” or spatial pulse length. The echogenicity was analyzed within regions of interest (ROIs) that were unexposed (No Doppler) and exposed (With Doppler) to Doppler pulses. (b) Example of ELIP flowing through the 0.4 mm thick latex tubing. The gray bars indicate the location of the Doppler “sample volume” or spatial pulse length. The echogenicity was analyzed in regions of interest (ROIs) located upstream and downstream of the Doppler “sample volume”.