
Figure 8.

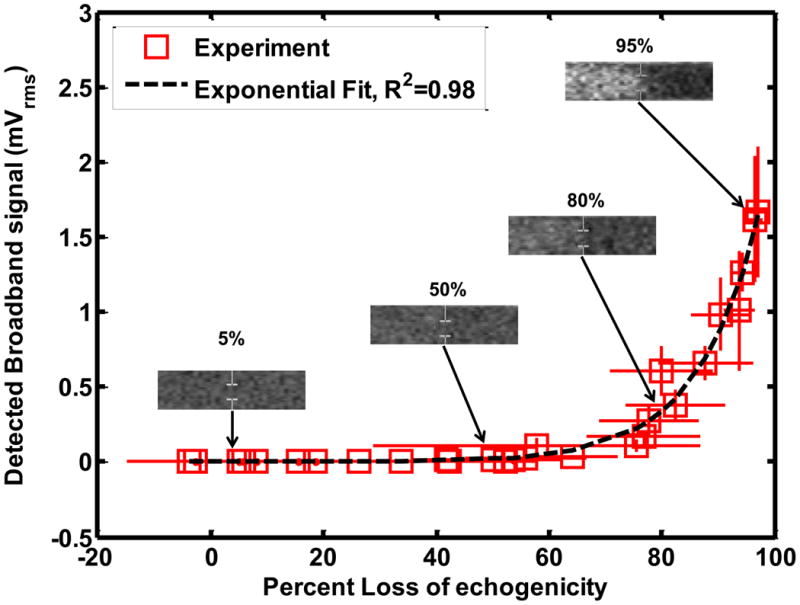
Relationship between loss of echogenicity and (a) subharmonic emissions, and (b) broadband emissions from ELIP insonified by Doppler pulses of duration 1.66 μs. The open squares represent the experimental data. The x and y error bars represent the standard deviation of four measurements. The dotted line represents an exponential fit. The insets show the onscreen echogenicity of ELIP flowing through the Doppler focus and the corresponding percent loss of echogenicity.