
Figure 2.
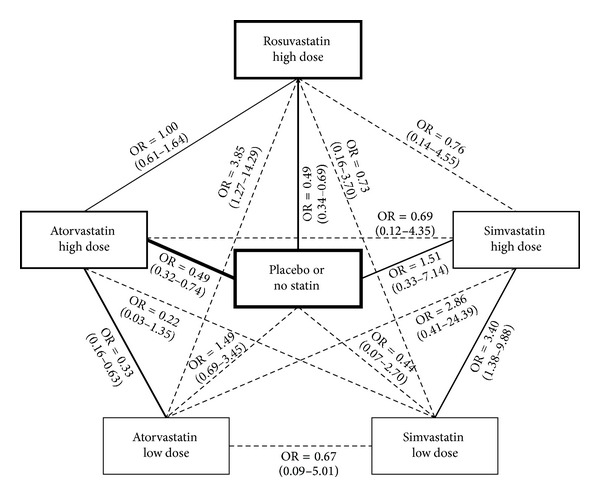
Evidence network. Continuous lines represent head-to-head randomized comparisons (the thickness of the line corresponding to the number of trials) with both direct and indirect effect estimates, whereas dashed lines represent only indirect effect estimates. The thickness of the rectangles corresponds to the patients receiving a specific treatment.