
Figure 3.
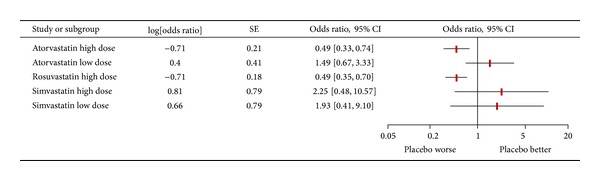
Forest plot summarizing risk estimates stemming from network meta-analysis comparing different statin regimens for the risk of contrast-induced nephropathy. OR = odds ratio; CI = confidence interval; SE = standard error.
Official websites use .gov
A
.gov website belongs to an official
government organization in the United States.
Secure .gov websites use HTTPS
A lock (
) or https:// means you've safely
connected to the .gov website. Share sensitive
information only on official, secure websites.
Forest plot summarizing risk estimates stemming from network meta-analysis comparing different statin regimens for the risk of contrast-induced nephropathy. OR = odds ratio; CI = confidence interval; SE = standard error.