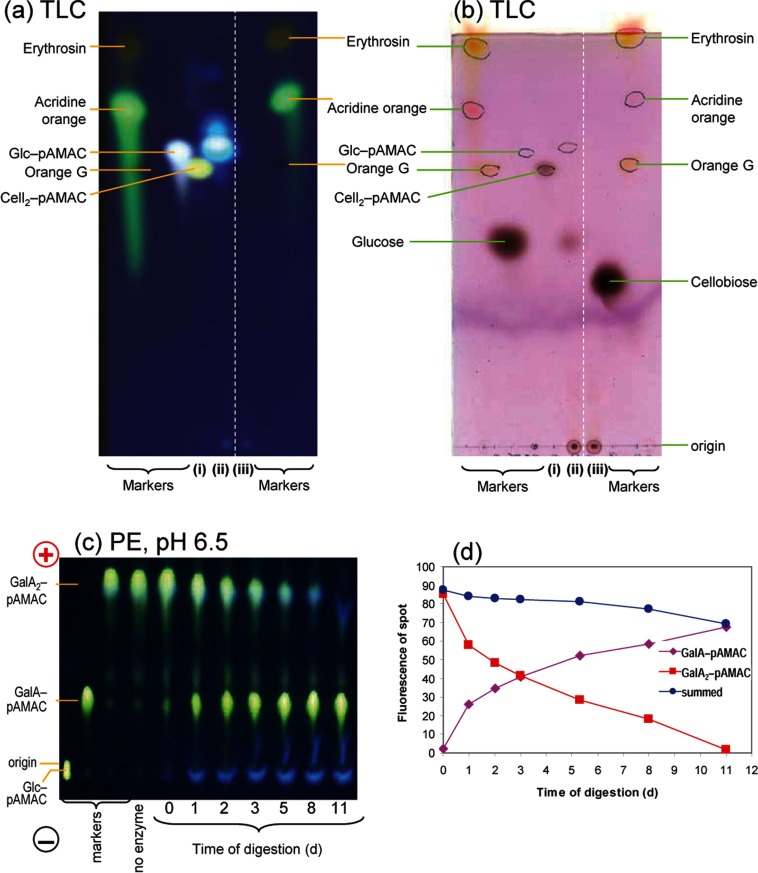
Figure 7. Driselase digestion of reducing-end-labelled cellobiose and galacturonobiose.
(a and b) TLC of cellobiose–pAMAC (Cell2–pAMAC) (i) alone and (ii) after digestion with Driselase for 3 days; (iii) Driselase alone. (a) UV fluorescence, (b) same TLC plate after sugar-staining with thymol-H2SO4, viewed under visible light. (c and d) Paper electrophoresis at pH 6.5 of galacturonobiose–pAMAC (GalA2–pAMAC) digested with Driselase for 0–11 days. (c) Viewed under a 254-nm UV lamp. (d) Quantification of fluorescence in starting material and product (arbitrary units of fluorescence; DocIt software).

