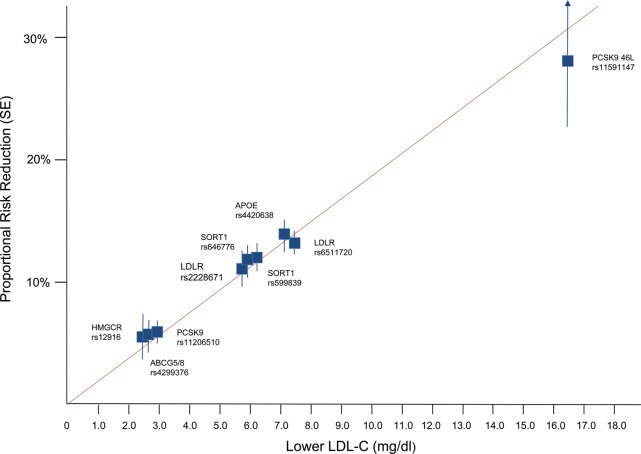
Figure 2.
Effect of lower LDL-C on risk of CHD [taken from Ference et al. (2012) (52)]. Boxes represent the proportional risk reduction (1-OR) of CHD for each exposure allele plotted against the absolute magnitude of lower LDL-C associated with that allele (measured in mg/dl). SNPs are plotted in order of increasing absolute magnitude of associations with lower LDL-C. The line (forced to pass through the origin) represents the increase in proportional risk reduction of CHD per unit lower long-term exposure to LDL-C.

