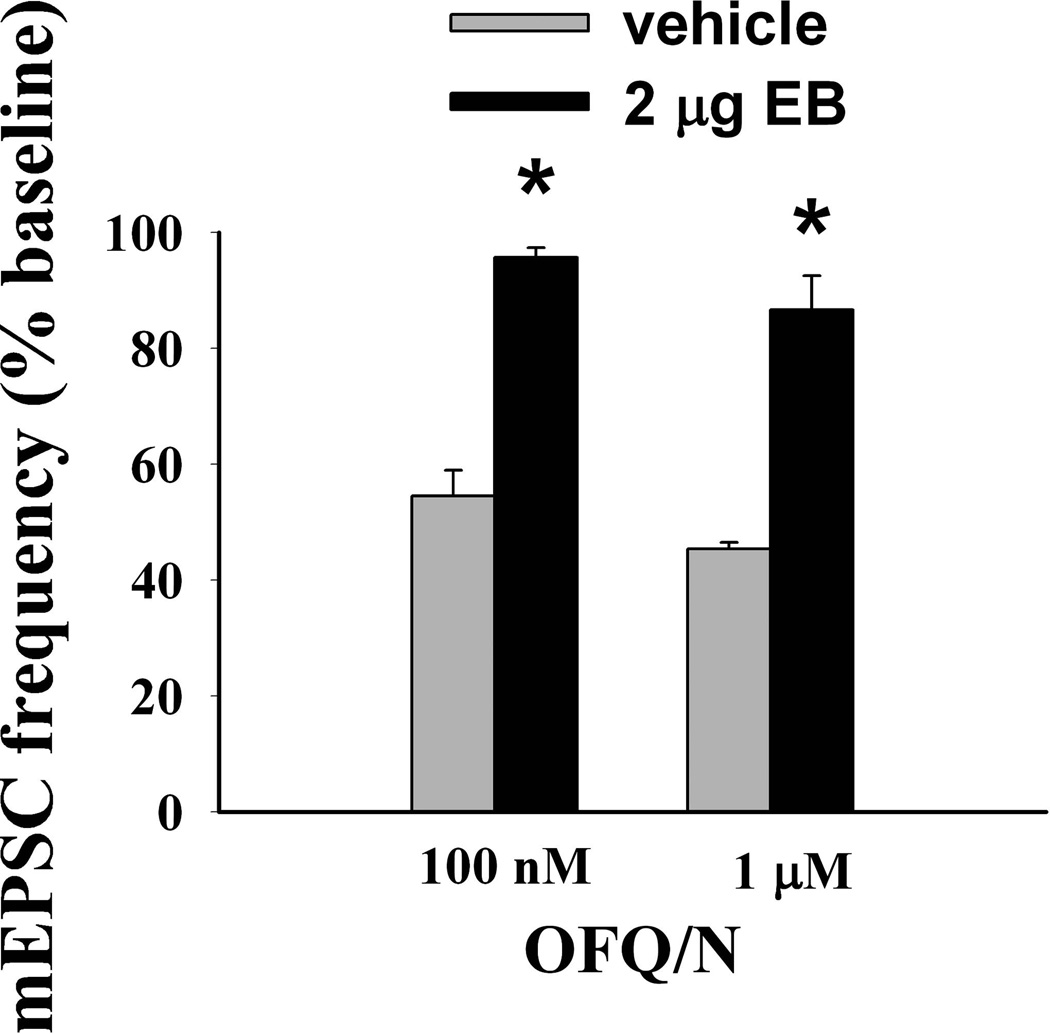
Figure 7.
A composite bar graph that illustrates the estrogenic attenuation of the OFQ/N-induced decrease in mEPSC frequency. Bars represent means and vertical lines 1 S.E.M. of the mEPSC frequency that was normalized to values observed under baseline conditions. * = P < 0.05, rank-transformed two-way ANOVA/LSD.

