Figure 6.

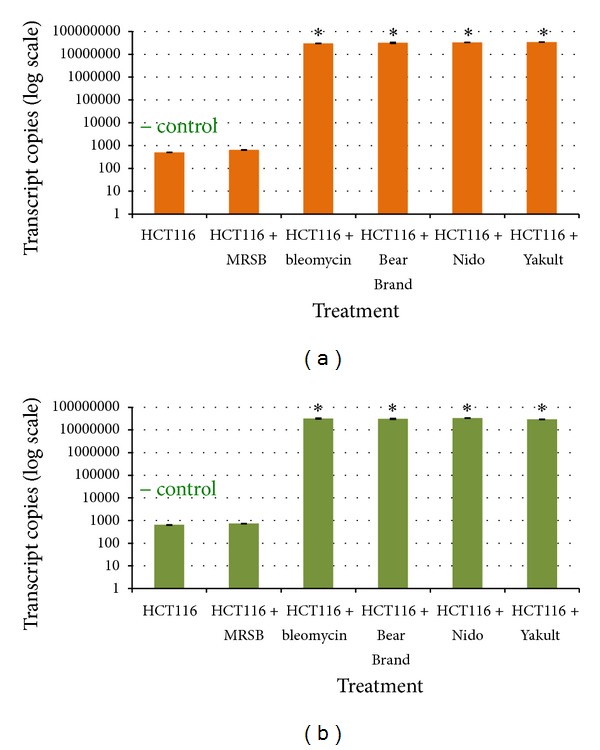
qRT-PCR plots of the transcript copy numbers of the early apoptosis markers (a) cfos and (b) cjun genes from treated and untreated HCT116 cells. Significant difference from the negative control is indicated by an asterisk ∗.

qRT-PCR plots of the transcript copy numbers of the early apoptosis markers (a) cfos and (b) cjun genes from treated and untreated HCT116 cells. Significant difference from the negative control is indicated by an asterisk ∗.