Figure 8.

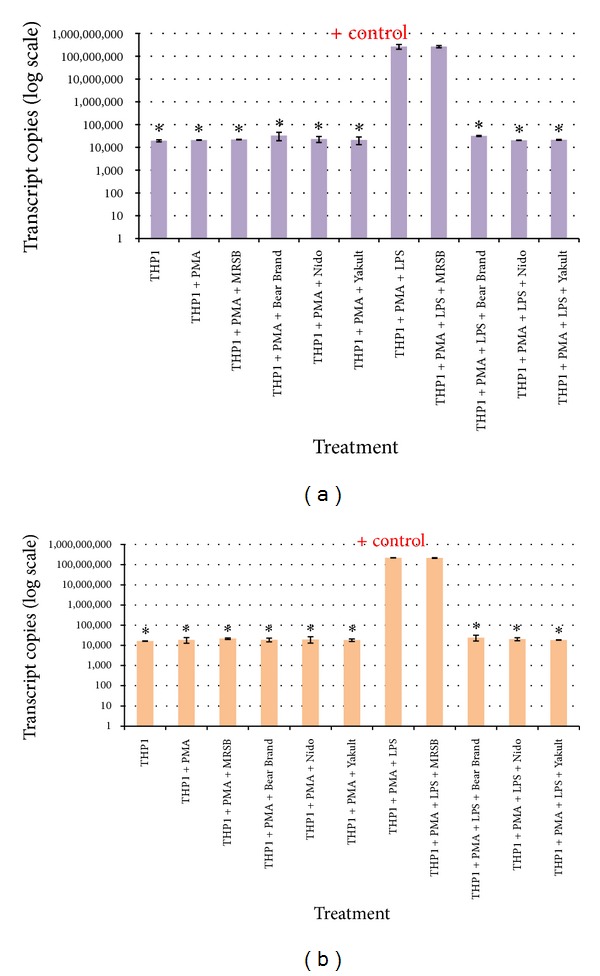
qRT-PCR plots of the transcript copy numbers of the (a) IL1- β and (b) TNF-αcytokine genes. Significant difference from the control group positive for inflammation is indicated by an asterisk ∗.

qRT-PCR plots of the transcript copy numbers of the (a) IL1- β and (b) TNF-αcytokine genes. Significant difference from the control group positive for inflammation is indicated by an asterisk ∗.