
Figure 2.
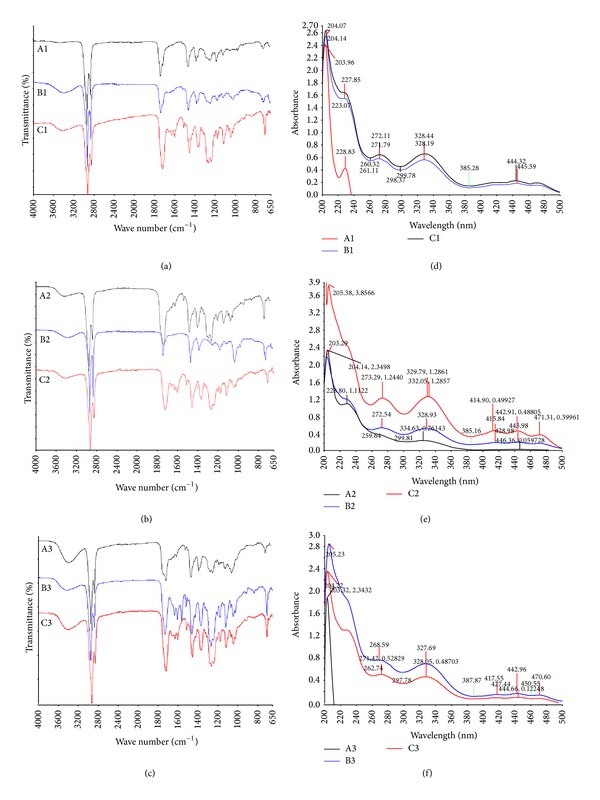
FTIR and UV-Vis spectra of the 9 SC-CO2 extracts of O. stamineus. (a) The extracts A1, B1, and C1 (40°C). (b) The extracts A2, B2, and C2 (60°C). (c) The extracts A3, B3, and C3 (80°C). (d) The extracts A1, B1, and C1 (40°C). (e) The extracts A2, B2, and C2 (60°C). (f) The extracts A3, B3, and C3 (80°C).