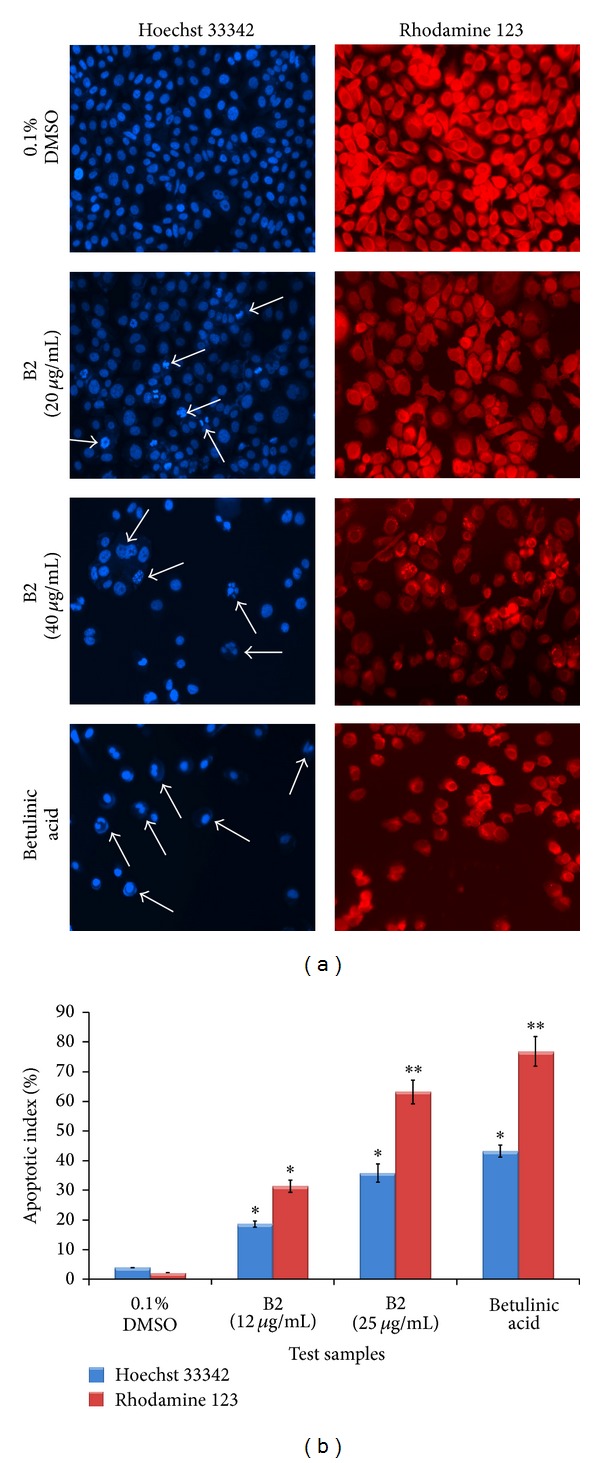
Figure 6.

Proapoptotic effect of B2 on PC3 cells. The cells were treated with two concentrations (12 and 25 μg/mL) of B2 and analysed separately at 12 hr. DMSO (0.1%) and betulinic acid (10 μg/mL) were used as negative and positive controls, respectively. The cells were fixed in 4% paraformaldehyde and then stained with either Hoechst stain 33342 (1 μg/mL in PBS) or rhodamine 123 (5 μg/mL) for 20 min. The cellular morphology was photographed at 20x magnification, using EVOS f1 digital microscope (Advanced Microscopy Group, USA). (a) The photomicrographs in the left column depict the images of PC3 cells stained with Hoechst 33258. The cells treated with 0.1% DMSO (negative control) appeared as confluent monolayer with prominent nuclear and other cellular features. The cells treated with B2 displayed clear characteristic changes of apoptosis. The arrows showed the condensed, fragmented, and crescent shaped nuclei indicating the early phase of apoptosis. In addition, the higher concentration of B2 displayed the chromatin dissolution, breakdown, and fragmentation (arrows), which imply the advanced stage of apoptosis. The results can be compared to that of the standard reference, betulinic acid. The photomicrographs in the right column depict the images of PC3 cells stained with rhodamine 123. The images provide the clear evidence of disruption in the mitochondrial membrane potential caused by B2. The effect in PC3 cells was assessed by visualizing the rhodamine 123 fluorescence signals in the mitochondria. Treatment of cells with B2 showed that the signal decreased proportionally with respect to the decrease of mitochondrial membrane potential. (b) Graphical representation of percentage of apoptotic indices. The apoptotic index for each test group was expressed as a percentage of the ratio of apoptotic cells number to the total cell number in 10 different fields. In Hoechst stain assay, cells with densely blue-colored, condensed, or fragmented nuclei were considered apoptotic. The number of cells with apoptotic morphology was counted in randomly selected fields per well. The apoptotic index was calculated as a ratio of apoptotic cells to the total number of cells and presented as the mean ± SD (n = 10); ∗ represents P < 0.05 and ∗∗ represents P < 0.01.
