
Figure 2. Age and sex-adjusted associations between anthropometric variables and mortality Upper row of figures is for all-cause mortality, lower for CVD mortality.
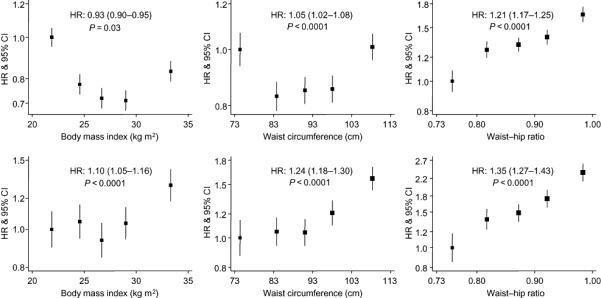
For the association between each anthropometric variable and the outcome of interest, boxes are for the effect estimate (hazard ratio) and the vertical bars about are for the 95% confidence interval (CI). On the horizontal axis, the hazard ratio for each quintile is plotted against the quintile specific median of the anthropometric variable. For each figure, the hazard ratio (HR) and the 95% CI for a standard deviation for a one higher standard deviation in each anthropometric variables are shown. The p-value is for the log-linearity of the association. The vertical axis is on log scale to allow equal distribution of the CI about the estimates.